
Why not just use the free satellite view?
It is a fair question, and sometimes the honest answer is that you should. So here is the whole comparison in one place — how much ground fits in a pixel, how old that pixel is, and what you are actually allowed to do with it. Every number below comes from the other side's own published documentation, with links, so you can check us.
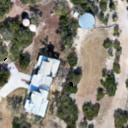
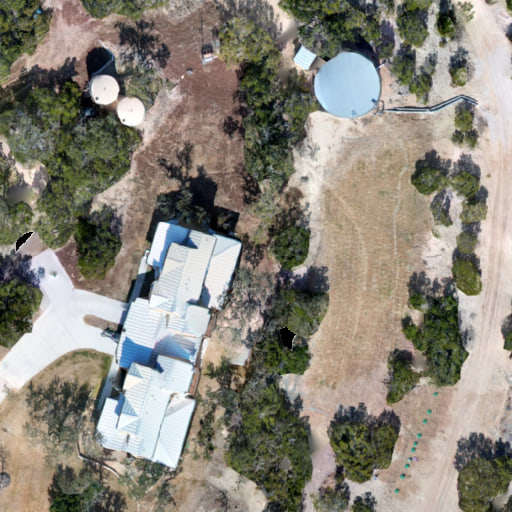
Drag the handle. Same ranch, same moment, same source file — the only thing that changes is how much ground fits in one pixel. Left is 12.9 cm; right is 51.6 cm, which is what a 50 cm global basemap has to work with out here. Both squares cover the same 66 metres of ground.
Being fair about it: the sharp half is a web preview from our public sample project, not the file we hand over. What we capture on a mapping flight is 1 to 3 cm per pixel — several times finer again than the left-hand side of this slider. And the coarse half, if anything, flatters the comparison: a resample of sharp imagery is cleaner than a native 50 cm capture, which carries its own softness. Neither half came from anyone else's imagery — both are cut from our own published tiles of the same flight.
A pixel is a decision you can't make later
At half a meter per pixel, a stock tank and a slab look like the same beige smudge. You can see that a building is there. You cannot count the bays, find the roof seam, measure the driveway or tell a cedar from a live oak.
At a centimeter or two, the picture stops being a locator and starts being a measurement. That is the whole difference between a map you point at and a map you build from.
Both halves are cut from our own published tiles — no vendor imagery was fetched to make this. The centimeters-per-pixel figures are standard Web Mercator arithmetic for 256-pixel tiles, which is what our pyramid serves. If you check them against the vendor's published zoom table, note that table assumes 512-pixel tiles — their own glossary gives the conversion:
“To determine the per-pixel value for 256x256 tiles, take the zoom level you're interested in and look at the row above it.” [6]
On that rule the two agree exactly: their zoom-17 row is 0.597 m per pixel at the equator, which at this ranch's 30.25°N is the 51.6 cm printed above. The 50 cm figure is their published global baseline. [1],[6]
Resolution
A global basemap has to cover the whole planet, so it buys pixels at planet scale. We fly one property and buy pixels at property scale. That single difference is most of the gap.
How much ground is in one pixel?
A global satellite basemap
The published baseline is 50 cm for the world, with higher resolution in certain areas of the US, Canada, Europe and Australia/NZ. A 30 cm refresh released 10 million sq km in January 2026 — and the announcement is worth reading in full, because it covered more than city centres. [1],[3]
“A base of 50 cm imagery for the world (excluding Antarctica and Greenland).” [1]
“The newly updated imagery covers primarily areas with populations over 500,000 people, but also includes large, uninterrupted swaths of the United States and Europe.” [3]
What we hand you
1 to 3 cm. Against the 50 cm baseline that is 17 to 50 times finer across, and roughly 280 to 2,500 times more pixels on the same acre. Against the 30 cm tier it is still 10 to 30 times finer across.
What about the really sharp imagery I've seen?
A global satellite basemap
It exists, and the tileset reference is specific about how much of it there is and where. The sharpest tier is aerial imagery — Vexcel over North American and some European cities, plus open aerial imagery from the Netherlands, Denmark, France, Germany, Chechia, Poland, Spain, New Zealand and other regions. [1],[2]
“This tileset includes global coverage to zoom 16 (1–2 m resolution), regional coverage to zoom 18 (0.6–0.3 m resolution), and select coverage to zoom 21+ (7.5 cm+).” [1]
“Higher resolution imagery in certain areas in the US, Canada, Europe, and Australia/NZ.” [1]
What we hand you
There is no city tier and no countryside tier. A 40-acre ranch an hour from a highway gets the same flight plan and the same centimeters as a job downtown.
Can I get elevation and contours from it?
A global satellite basemap
Global terrain data stops at zoom 14. The reference publishes no horizontal resolution at all — the only figure it gives is vertical, 0.1 meter height increments — and the vendor's own zoom table puts zoom 14 at 4.777 meters/pixel at the equator on the 512-pixel tiles that table assumes. It also warns that the source elevations mix vertical datums, so absolute heights are not consistent between regions. [4],[6]
“Data is available up to zoom 14. Renderers will interpolate and smooth at higher zoom levels but will not increase the resolution of the data loaded by your application.” [4]
“Different sources often use different vertical datum references; thus, attempting to normalize Mapbox elevation data to a particular geoid or vertical datum may lead to inaccuracies in data.” [4]
What we hand you
A terrain surface built from your own flight, on one declared datum, with contours you can hand to a civil engineer. Elevation is the deliverable, not a shading effect.
Can it show a real 3D model of my property?
A global satellite basemap
The map style specification defines eight source types. None of them is a point cloud, a 3D Tiles set, a gaussian splat or a 360 panorama. It does define one 3D type — and the spec says in its own words what that type is for. [5]
“Specify the type of source with the type property, which must be one of vector, raster, raster-array, raster-dem, geojson, image, video, model.” [5]
“A model source referencing 3D models to be used with model layer.” [5]
What we hand you
Four of them are shipped viewers you open in a browser — photoreal mesh, 3D Tiles, point cloud and gaussian splat — sitting beside the flat map on the same page. Ground-level 360s ride the same platform when a site calls for them.
Recency
The question is never just how sharp the picture is — it is when it was taken. A global basemap publishes no refresh schedule and updates where the demand is. A flight has a date because you picked it.
How often does it get refreshed?
A global satellite basemap
There is no published schedule. The imagery reference and the terrain reference each say so, in their own words, about their own data. [1],[4]
“Imagery is not improved on a set schedule and is updated when and where it becomes available.” [1]
“Elevation data is not improved on a set schedule and is updated when and where it becomes available.” [4]
What we hand you
You pick the date. We fly it, and the delivery carries that date.
So when does my area get its turn?
A global satellite basemap
Update priority follows demand, and the documentation is open about what feeds it. The January 2026 refresh went primarily to areas with populations over 500,000 people — though, in fairness, it also included large uninterrupted swaths of the United States and Europe. [2],[3]
“To determine where to update imagery, we take into account industry use cases and needs, customer feedback, and internal data on tile requests and zoom levels.” [2]
What we hand you
There is no queue. Ranch country is the whole business, not the leftover.
Can I prove when the picture was taken?
A global satellite basemap
The mosaic blends several providers — MODIS at the low zooms, Maxar through the middle, Vexcel and open aerial imagery at the top — color-corrected and blended into a single raster tileset, and the reference says the mix changes with both zoom level and geography. [1]
“Data sources differ depending on zoom level and geographic availability.” [1]
What we hand you
Every delivery is stamped with the flight date, and repeat flights sit next to each other so you can compare two dates on the same ground.
Rights
This is the part nobody talks about, and it outlives both of the others. Rented map imagery comes with a rulebook about what you may do with it. The imagery we fly for you does not.
Can I put it in a printed report?
A global satellite basemap
Not by default. Print use is prohibited except through named carve-outs, and printed media are defined to include PDF, JPG and PNG — so a client report counts. Studio allows up to 100 high resolution static digital copies for the lifetime of the account; beyond that, print rights must be bought in an active Order, and even purchased print rights stay limited to Mapbox Streets v8 or later (plus Japan map data for educational or private use). [7]
“Customer may use Studio to make up to an aggregate total of 100 high resolution static digital copies of Licensed Map Content during the lifetime of Customer's account.” [7]
What we hand you
Print it. Frame it. Put it in the offering memorandum, the permit packet and the bank submission. There is no export counter.
Can I trace it into CAD or GIS for commercial work?
A global satellite basemap
Tracing or otherwise deriving content is prohibited, with one narrow exception: satellite-only maps may be traced into derivative vector datasets for non-commercial purposes or for OpenStreetMap. Commercial digitizing is not in the exception. [8]
“Customer may use Studio or third-party software to trace Mapbox Maps solely comprised of satellite imagery to produce derivative vector datasets (i) for non-commercial purposes or (ii) for OpenStreetMap.” [8]
What we hand you
Digitize away. DXF for CAD, Shapefile and GeoJSON for GIS, KMZ for any map app — all part of the delivery, and what your engineer draws on top belongs to you.
Can I use it to check or improve my own imagery?
A global satellite basemap
No. One unconditional sentence, with no exception attached. For anyone producing their own imagery, that rules out using it as an alignment, color or sanity-check reference. [10]
“Customer shall not use Mapbox's satellite and/or aerial imagery to improve the accuracy of or otherwise enhance any imagery.” [10]
What we hand you
It is your imagery. Align to it, color-match against it, use it as the reference for the next flight.
Can I train a model on it?
A global satellite basemap
No, with one carve-out that does not help you here: the ban covers using the service offerings to train, operate or improve machine-learning or AI, except for Mapbox Traffic Data and Movement Data where an active Order expressly permits it. Imagery is not in the exception. [9]
“use the Service Offerings to train, operate or improve machine-learning or artificial intelligence (AI) technologies (except with respect to Mapbox Traffic Data and Mapbox Movement Data only if expressly permitted under an active Order)” [9]
What we hand you
Train on it. Count your cattle, your trees, your pallets, your parking spaces — on your own pixels, with whatever model you like.
Can I take it offline, into a field with no signal?
A global satellite basemap
Downloading, caching or storing map content is prohibited by default. The narrow exception is a cache on an end user's own device, populated directly from the APIs, kept no longer than thirty days. [11]
“Customer may cache that Licensed Map Content on an End User's device but caching is limited to thirty (30) days on the same device making the Mapping API request.” [11]
What we hand you
Download the whole thing. GeoTIFF, LAZ, GLB, PDF — the files live on your drive, and they still open on the tailgate with no signal at all.
What actually happens if I stop paying?
A global satellite basemap
The imagery is licensed, not sold — and since storing a copy was never permitted beyond a thirty-day cache on an end user's own device, there is nothing left over when the account ends. [11],[12]
“Licensed Map Content does not include Customer Uploads or Third-Party Data.” [12]
What we hand you
Nothing happens to your data. It was a delivery, not a rental — and the same terms say it plainly for uploads. What we fly for you was never theirs to restrict.
Isn't there free public imagery I can just use?
A global satellite basemap
Yes, and we will tell you when it is enough. Federal NAIP imagery over Texas is public domain and free to download, and the service describes itself as primarily 0.6 meter. For a wide-area context map it is genuinely the right tool. [13]
“The USGS NAIP Imagery service is a mosaic primarily of 0.6 meter resolution 4-band imagery presented in natural color.” [13]
What we hand you
Where it stops being enough is anything you have to measure, plan or price — a stockpile volume, a pad elevation, a drainage line, how much fall a field has.
Do you fly near me?
Type a county or a town. This is the coverage we publish, not a list of jobs — where our clients own land stays their business.
Counties we publish coverage for
5 coverage areas across 7 counties
Austin
Travis Co.
Austin, Round Rock, Cedar Park, Pflugerville, Leander, Westlake Hills
San Antonio
Bexar Co.
San Antonio, New Braunfels, Boerne, Cibolo
Hill Country
Hays Co. · Blanco Co. · Comal Co. · Gillespie Co. · Burnet Co.
Wimberley, Fredericksburg, Johnson City, Marble Falls, Dripping Springs
Dripping Springs
Hays Co.
Dripping Springs, Belterra, Caliterra, Driftwood
San Marcos
Hays Co.
San Marcos, Kyle, Buda, Wimberley
Where every number came from
All of it is public. We built this page from published documentation and published terms — deliberately, because a comparison you can verify is worth more than one you have to take our word for. Where we quote, the quotation is word for word from the single page its reference number points at.
- [1] Mapbox Satellite tileset reference — Overview, Data sources, Data updates, Layer ReferenceRead 2026-08-06
- [2] Mapbox — Imagery (dive deeper) — How do we determine where to update?, What is the breakdown of imagery by zoom level?Read 2026-08-06
- [3] Mapbox blog — 10 million sq km of new 30 cm satellite imagery — Published January 7, 2026Read 2026-08-06
- [4] Mapbox Terrain-DEM v1 tileset reference — Data sources and updates, Layer Reference, Elevation dataRead 2026-08-06
- [5] Mapbox Style Specification — Sources — The permitted values of the source `type` propertyRead 2026-08-06
- [6] Mapbox glossary — Zoom level — Tile size, Zoom levels and geographical distanceRead 2026-08-06
- [7] Mapbox Product Terms (July 21, 2026) — §1.7 Print or Video Use, §1.7.1–§1.7.4Read 2026-08-06
- [8] Mapbox Product Terms (July 21, 2026) — §1.6 No Tracing, Deriving, or ExtractingRead 2026-08-06
- [9] Mapbox Product Terms (July 21, 2026) — §1.5 No Derived Works, Reverse Engineering, or Competitive Uses — clause (ii)Read 2026-08-06
- [10] Mapbox Product Terms (July 21, 2026) — §2.8.2 Mapping APIs — satellite and aerial imageryRead 2026-08-06
- [11] Mapbox Product Terms (July 21, 2026) — §1.9(v) default restrictions, §2.8.1 thirty-day end-user cacheRead 2026-08-06
- [12] Mapbox Product Terms (July 21, 2026) — §3.32 Licensed Map Content excludes Customer UploadsRead 2026-08-06
- [13] USGS / USDA National Agriculture Imagery Program (NAIP) — ImageServer service descriptionRead 2026-08-06
- [14] Texas Occupations Code, Chapter 1071 — Land Surveying — Practice of land surveyingRead 2026-08-06
How this page was built. Entirely from public documentation and published terms, reviewed on 2026-08-06. We did not run anything against anyone's live service to produce it — their terms forbid using their service to benchmark a competing product, and a page sourced from documentation is the more checkable artifact anyway.
Terms and documentation change. If you are reading this long after the date above, check the links — and if you find something here that has gone stale, tell us and we will fix it.
Comparisons name the vendor only to cite them. All product names and terms belong to their respective owners; nothing here implies any affiliation or endorsement.
This data is not a legal survey. Embry Solutions LLC does not perform land surveys. For boundary, subdivision, or title surveys, please consult a licensed Texas surveyor. Texas Occupations Code ch. 1071.
The pixels are yours to keep
Resolution is what sells the first flight. Rights are why the data still matters in five years — print it, trace it, take it offline, train on it, hand it to the next engineer. Tell us the property and we will price the flight.