Home
Who we serve · Central Texas

Industries We Serve

From jobsites to ranches, we fly for the people who work Central Texas land. Whatever the property, every deliverable lands on your own private platform — crisp aerial maps and measurable 3D models you open, measure, and share from any browser, accurate to about a centimeter. Nothing to install.

01 / 11

Ranches & Agriculture

Every acre documented — boundaries, water, and the ground under the brush

Landowners and operators use our maps to get their arms around big properties they can't cover on foot — accurate acreage, fence lines, water features, and the real terrain hiding under the cedar. It's the Hill Country ground we know best, from Dripping Springs to the Pedernales, and one flight documents what would take days to walk. And where the drone can't reach — under the canopy, along the trails, up close to the structures — ground-level 360° walkthroughs let you revisit the property at eye height, navigable right on the map.

Challenges we solve

  • Hundreds of acres you can't cover on foot
  • No accurate acreage or fence-line record for the property
  • Cedar and brush hiding the real ground, washes, and erosion
  • Water, pasture, and roads you manage by guesswork
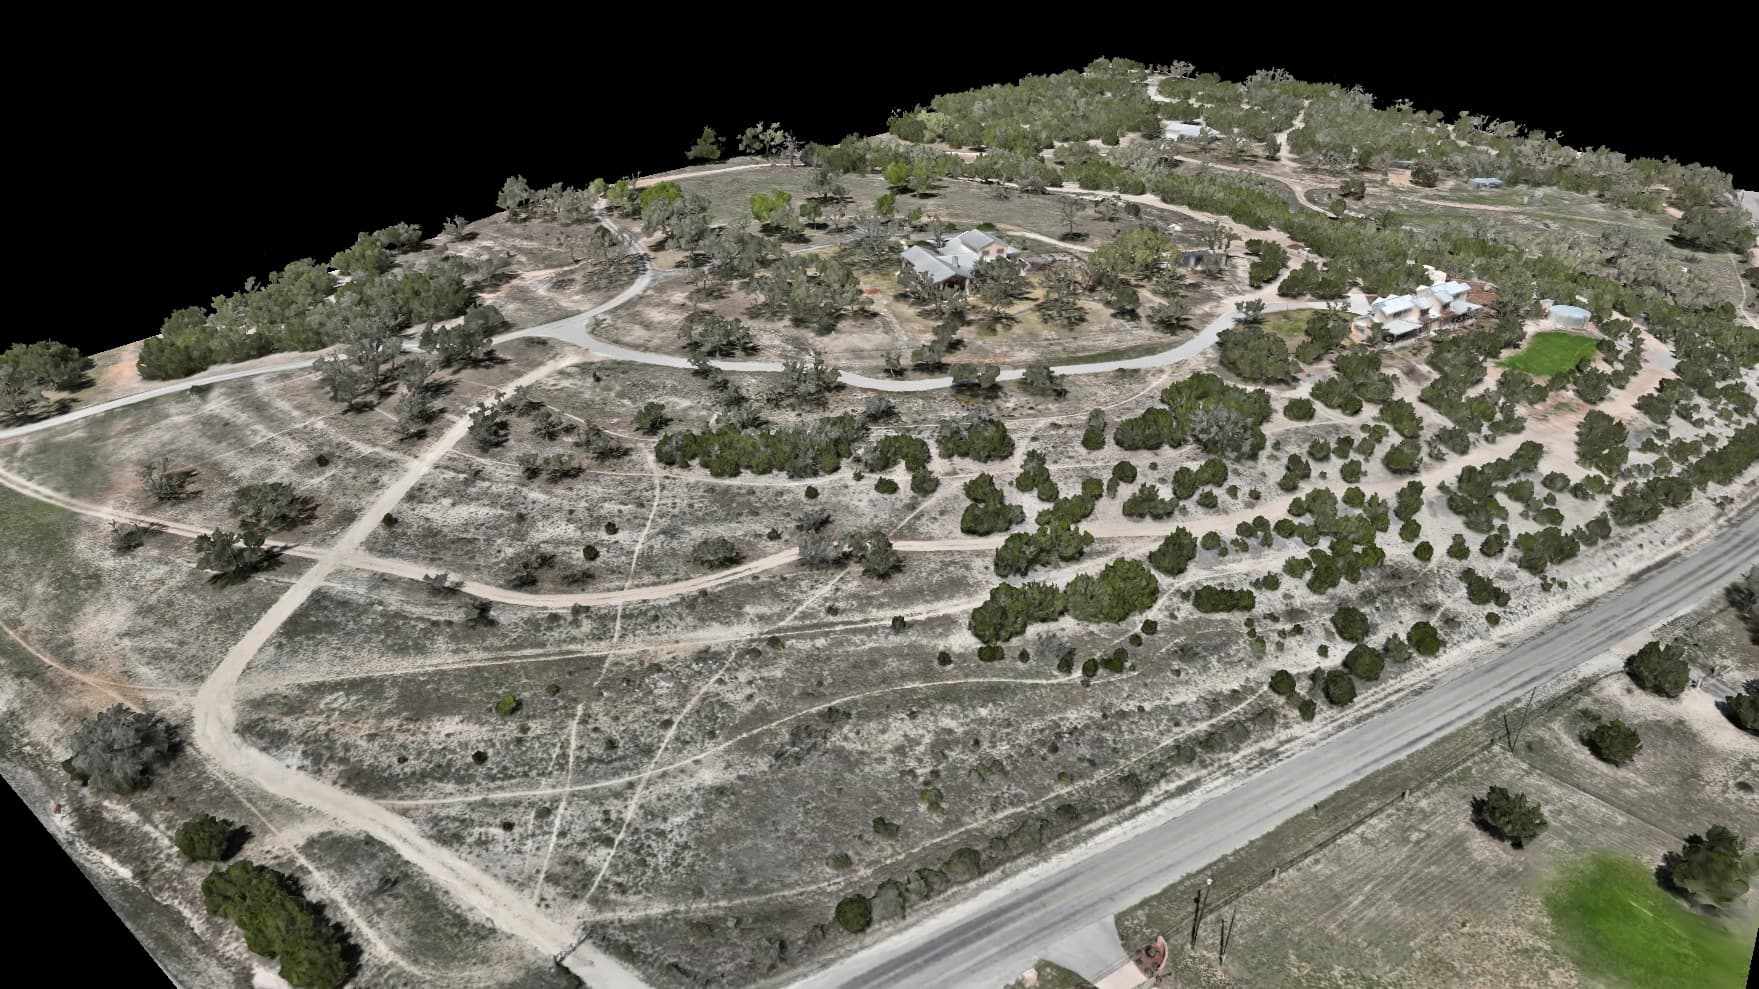
Photoreal 3D model of a Hill Country ranch captured from the air
3D model · Hill Country ranchOpen in demo

What you get

  • Full-property aerial map and photoreal 3D model
  • Accurate acreage and fence-line measurement
  • Terrain under the tree cover for water and erosion planning
  • Elevation map for ponds, drainage, and road placement
  • Ground-level 360° walkthroughs of trails, water crossings, and structures, pinned to your map
  • Optional 3D-printed relief of your property, sized to spec
See the full Ranches & Agriculture page
02 / 11

Construction

The whole jobsite, measured — current every flight

General contractors and site supers use our maps to document progress, settle earthwork with real volumes, and show owners the site without a truck roll. One flight turns the jobsite into a map you can measure to about a centimeter — 25 to 50 times tighter than handheld GPS — usually back in 3–5 business days. Fly it on a cadence and you've got a dated record of the whole build, in a browser link anyone can open.

Challenges we solve

  • No current record of what the site actually looks like today
  • Earthwork and stockpile disputes with no volume numbers to back you up
  • Progress updates that cost another site visit and a walk-through
  • Owners and partners who need eyes on the site but can't make the drive
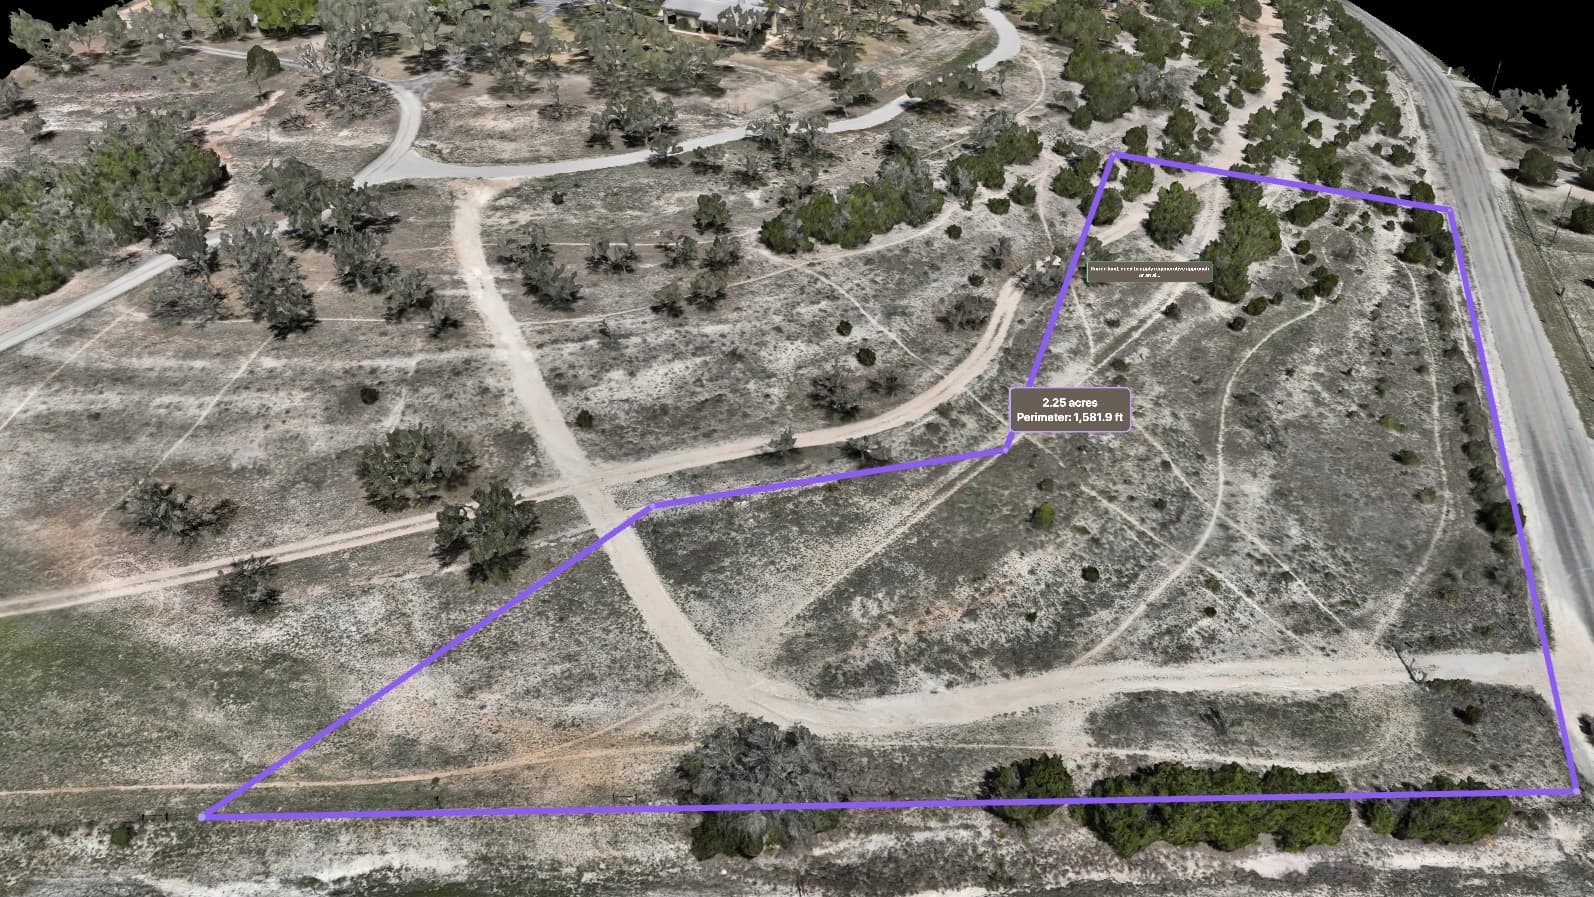
Aerial map of a construction site with area and volume measurements marked
Measured aerial map · cut & fillOpen in demo

What you get

  • Sharp aerial map on every flight, accurate to about a centimeter
  • Cut/fill and stockpile volumes you can put in a report and defend
  • 3D model that drops straight into your design software
  • Elevation map for grading and drainage checks
  • Ground-level 360° walkthroughs pinned to the map for as-built documentation
  • Private browser viewer for owners and crews — a link, nothing to install
See the full Construction page
03 / 11

Land Development

Know the ground before you buy it or break it

Developers and civil engineers use our terrain data to pressure-test a site before the pro forma is locked in. Laser scanning sees the real ground under the cedar and oak, so slope, drainage, and buildable acreage become numbers on the table — not surprises you find after closing. Catching one drainage problem early can pay for the flight many times over.

Challenges we solve

  • Buying acreage without knowing the real lay of the land
  • Drainage and slope surprises that blow a hole in the pro forma
  • Tree cover hiding the ground you're planning to build on
  • County topo too coarse to plan a real site from
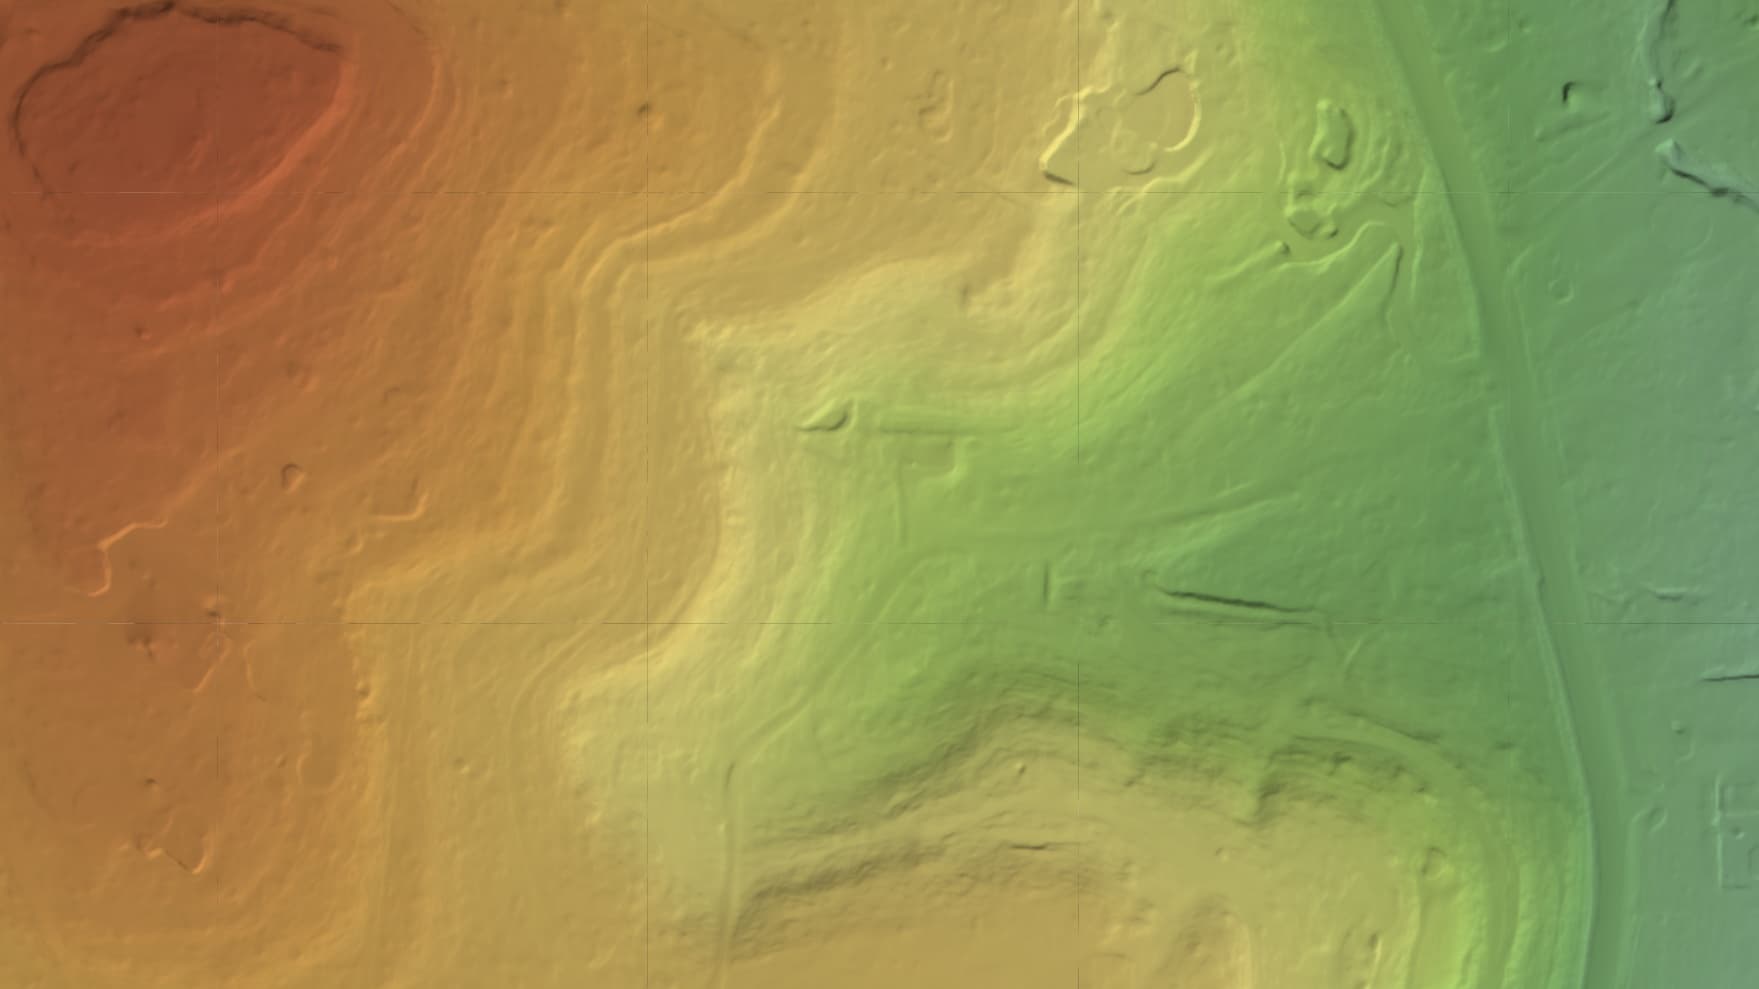
Bare-earth terrain hillshade of a Hill Country parcel showing slope and drainage
Bare-earth terrain · hillshadeOpen in demo

What you get

  • Bare-earth terrain with the tree cover stripped away
  • Contour lines at 1–2 ft steps, layered in your browser viewer
  • Elevation model for slope, drainage, and cut/fill planning
  • Accurate acreage and boundary context for your feasibility math
  • Ground-level 360° walkthrough for documenting the site's existing conditions
  • Interactive viewer to walk the site with your team and investors
See the full Land Development page
04 / 11

Real Estate

Sell the whole property, not just the house

Agents and brokers use our aerial maps and 3D models to sell land the way ground photos can't — the size, the setting, and the lay of a property a buyer can explore from a single link. It's presentation that wins the listing and gets out-of-town buyers to yes without a second showing.

Challenges we solve

  • Listings that show the house but never the land around it
  • Buyers who can't grasp the size or setting from ground photos
  • Big rural parcels a single photo can't hope to capture
  • Competing on presentation in a tight market
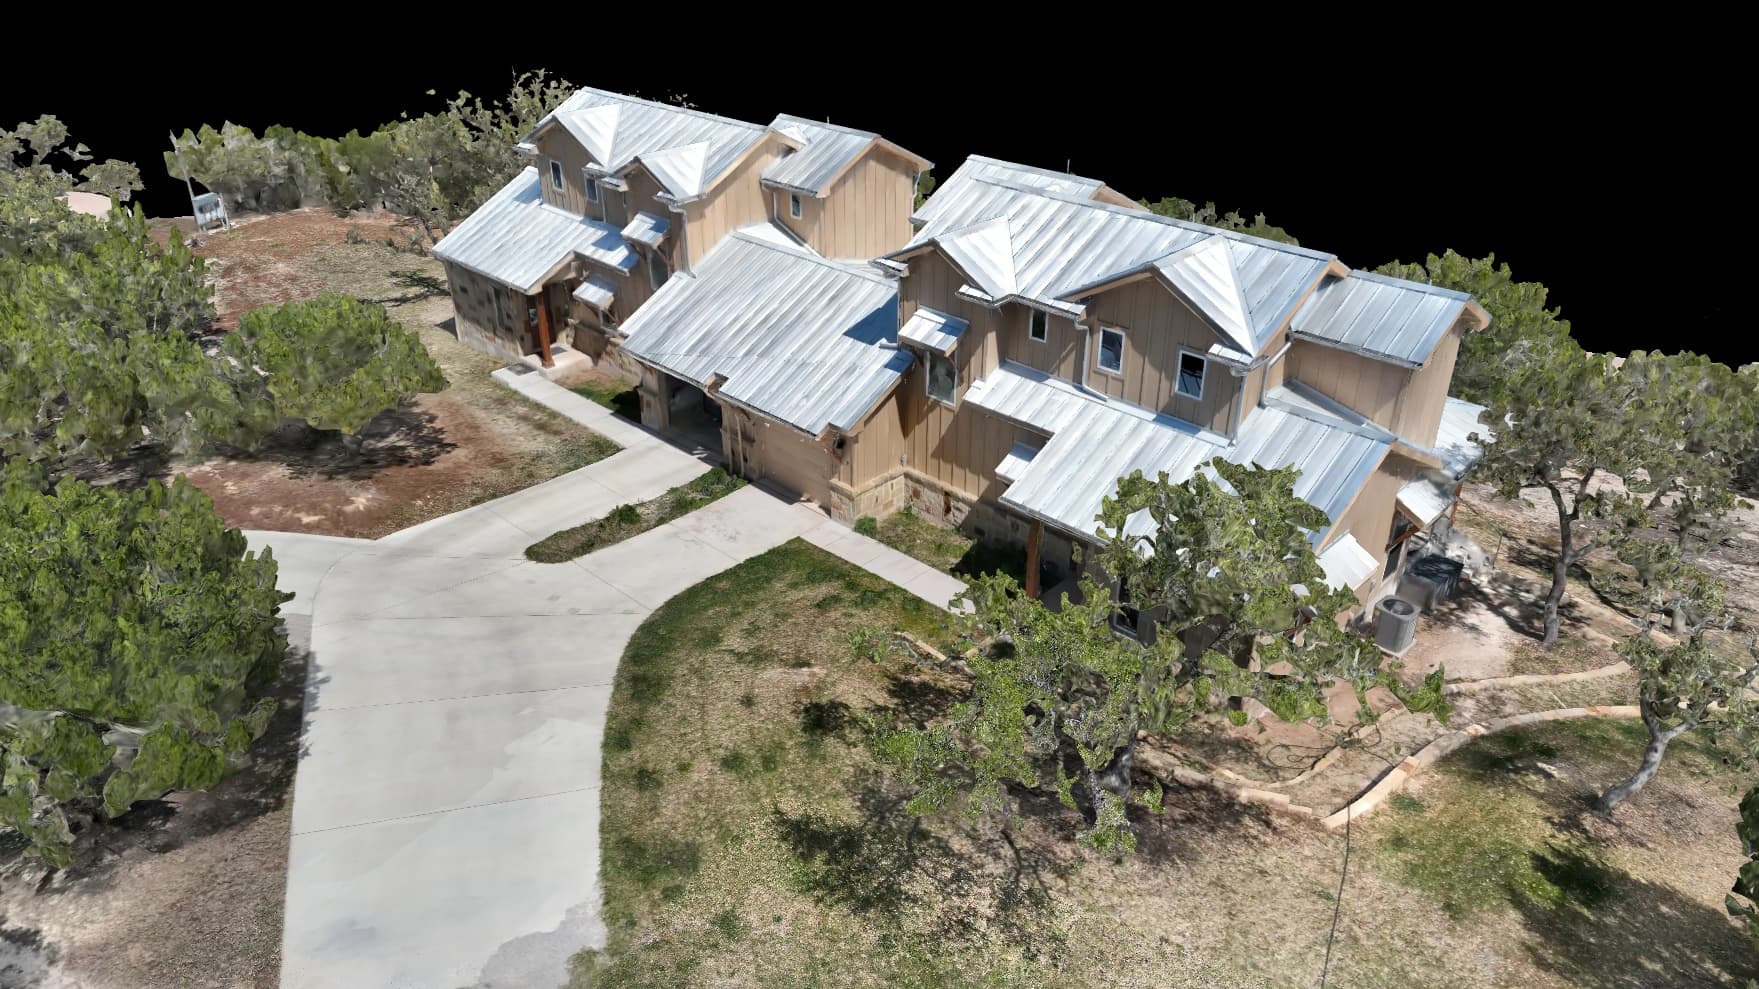
Photoreal 3D model of a custom home and its site captured from the air
3D model · custom home siteOpen in demo

What you get

  • Cinematic aerial map and photoreal 3D model of the property
  • Boundary and acreage context a buyer can actually read
  • Shareable browser viewer for the listing — a link, nothing to install
  • Ground-level 360° walkthrough paired with the aerial — the whole property on one link
  • 3D model of the home and site to spin, measure, and show off

Best-fit services

See the full Real Estate page
05 / 11

Parks & Attractions

The whole park, mapped — every ride, path, and acre on one link

Theme and water parks, family-entertainment centers, campgrounds, and event grounds use our maps to document the whole property to about a centimeter — the rides and structures, the midways and parking, the landscaping, and the open ground still left for expansion. It's the master record operations, marketing, and planning teams work from without walking the park: a measurable aerial map, a photoreal 3D model, and ground-level 360° walkthroughs of the midway pinned right to it — a virtual tour anyone can navigate from a browser.

Challenges we solve

  • No current, accurate record of the whole property — rides, paths, structures, and open land
  • Expansion and construction planned off dated site drawings
  • Marketing that can't show the scale and layout of the park
  • Coordinating operations, maintenance, and safety across acres of attractions
Aerial map of a site with a measured, annotated layout
Measured aerial map · site layoutOpen in demo

What you get

  • Full-park aerial map and photoreal 3D model, accurate to about a centimeter
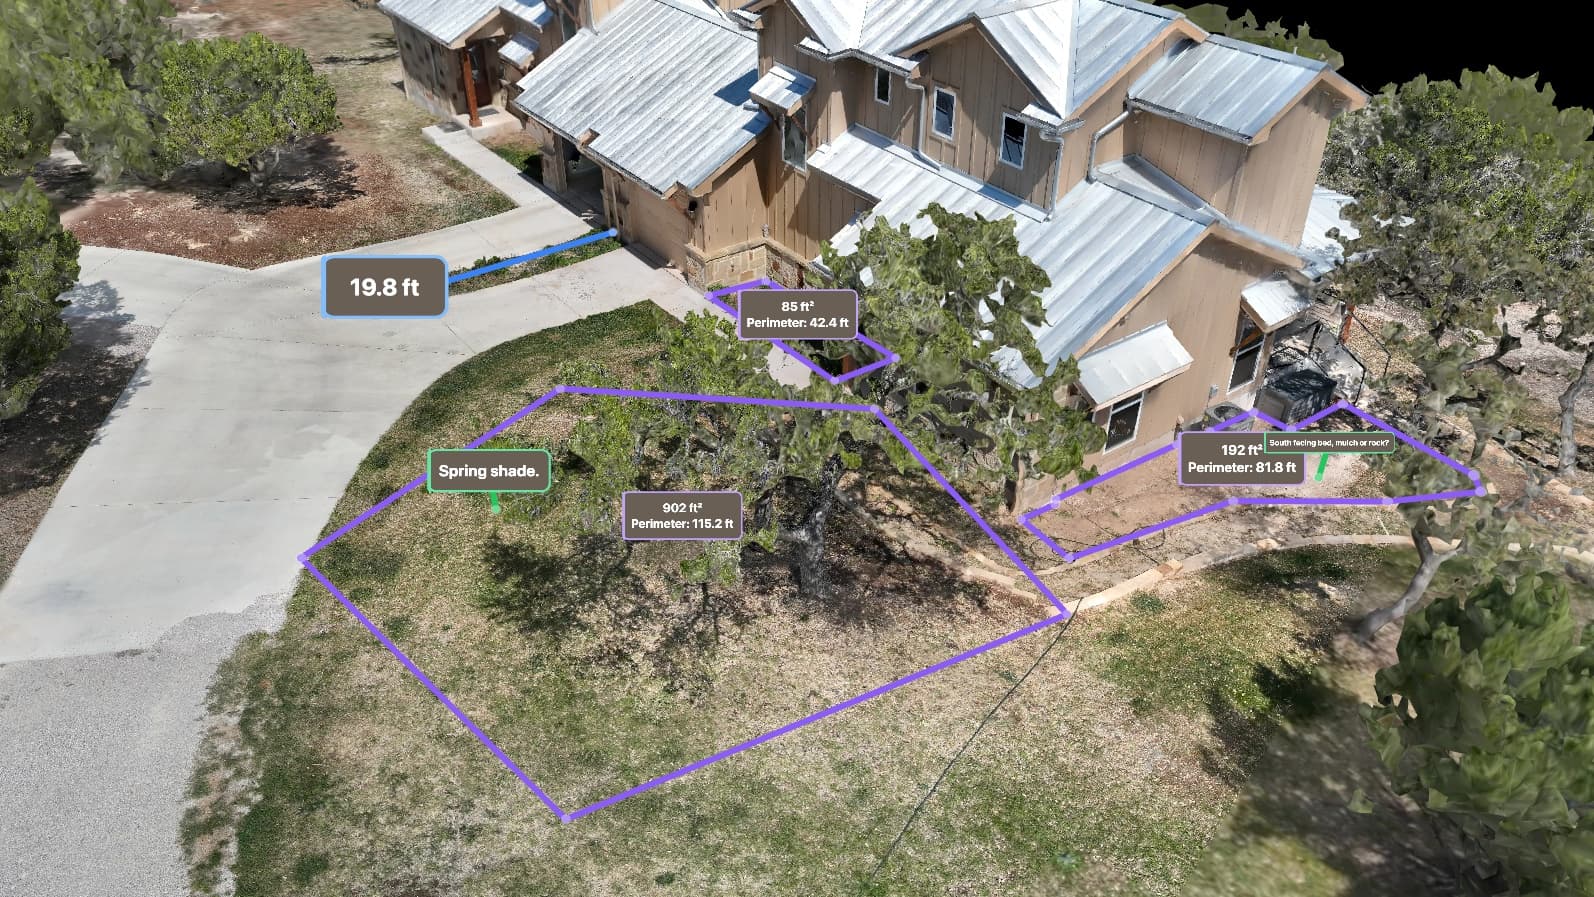
  • Measured layout of rides, paths, parking, and structures you can annotate
  • Elevation and terrain data for drainage, grading, and expansion planning
  • Ground-level 360° walkthroughs of the midway and attractions, pinned to the map
  • Shareable browser viewer for operations, marketing, and contractors — a link, nothing to install
  • A dated record on a cadence to track construction and changes between flights
See the full Parks & Attractions page
06 / 11

Guest Ranches & Recreation

Show the whole property — and let guests walk it before they arrive

Guest and adventure ranches, glamping sites and campgrounds, wedding and event venues, and agritourism operators use our maps to market a property the way ground photos can't — the setting, the trails, the water, and the acreage a guest can explore from a single link. Ground-level 360° walkthroughs turn the trails, cabins, and ceremony sites into a navigable virtual tour pinned to an aerial map, and the same data lays out the roads, fences, water, and events that make the property run.

Challenges we solve

  • Marketing a large property that a single photo can't capture
  • Guests and event clients who can't picture the setting or find their way around
  • Trails, roads, fences, and water managed across acres by guesswork
  • Laying out events and sites without a current map of the ground
Photoreal 3D model of a Hill Country ranch and recreation property captured from the air
3D model · ranch & recreation propertyOpen in demo

What you get

  • Cinematic aerial map and photoreal 3D model of the whole property
  • Ground-level 360° walkthroughs of trails, cabins, water, and ceremony sites, pinned to the map
  • Accurate acreage, trail, and boundary measurement
  • Elevation and terrain for road, water, and site planning
  • Shareable browser viewer and virtual tour for guests, clients, and your team — a link, nothing to install
  • Optional 3D-printed relief of the property, sized to spec
See the full Guest Ranches & Recreation page
07 / 11

Energy & Utilities

The site and the assets, seen from the air

Solar, utility, and infrastructure teams use our maps for current as-builts, siting terrain, and a close look at the assets themselves — across sites that take a truck and a crew a day to walk. As our thermal imaging and always-on monitoring come online, that extends to panel-fault detection and change tracking between flights.

Challenges we solve

  • Miles of infrastructure to inspect by truck and boots
  • No current as-built of the site or asset layout
  • Terrain and siting data that's slow and costly to collect
  • Vegetation creeping onto lines, pads, and easements
Classified 3D scan separating built assets, ground, and vegetation
Classified 3D scan · assets vs. groundOpen in demo

What you get

  • Site aerial map and 3D model, accurate to about a centimeter
  • Asset-level detail you can measure and annotate
  • Elevation and terrain data for siting and grading
  • Classified 3D scan separating assets, ground, and vegetation
  • Ground-level 360° walkthroughs documenting assets at eye height, pinned to the map
  • Private viewer to share condition with crews and stakeholders
See the full Energy & Utilities page
08 / 11

Aggregates & Quarries

Know your stockpiles to the ton — flown local, back in days

Aggregate producers, sand-and-gravel pits, and quarries use our maps to inventory stockpiles to the ton and track the pit as it changes — without pulling a crew off production to walk and measure. One flight turns the whole site into a measurable 3D scan and elevation surface, so pile volumes, cut/fill against a prior surface, and month-over-month change come back as numbers you can put in a report. Central Texas limestone country is our backyard, and a monthly scan pays for itself against a single miscounted pile.

Challenges we solve

  • Stockpile counts you can't trust — write-offs at every reconciliation
  • Pulling a crew off production to walk and measure piles
  • No dated record of how the pit and stockpiles change month to month
  • Cut/fill and reclamation volumes measured by estimate
Elevation surface of a site used for stockpile volume measurement
Elevation surface · stockpile volumesOpen in demo

What you get

  • 3D scan and elevation surface of the whole site, accurate to about a centimeter
  • Per-pile stockpile volumes in cubic yards and tons, from a polygon you draw
  • Month-over-month change and a one-page tonnage report
  • Cut/fill against a prior surface for pit and reclamation planning
  • Measurable browser viewer for operations, accounting, and management — a link, nothing to install
  • A monthly cadence that feeds an inventory record you can stand behind
See the full Aggregates & Quarries page
09 / 11

Golf Courses

Every fairway and green, mapped — water, turf, and drainage on one link

Course superintendents and club managers use our maps to plan irrigation and drainage, document the whole property, and settle turf and grading questions with real elevation data — across a property that takes a cart and a morning to walk. One flight turns the course into a measurable 3D model and elevation surface, so drainage, cut/fill, and acreage come back as numbers, and a dated record tracks the course through renovations and seasons. On a course where water is the biggest line item, the map pays for itself the first time it catches a drainage or coverage problem.

Challenges we solve

  • Irrigation and drainage planned without current elevation data
  • Water — the biggest cost on the course — managed by feel
  • No current map of the whole property for planning renovations
  • Grading, bunker, and cart-path work with no measured baseline
Shaded terrain map of a golf course used for drainage and irrigation planning
Shaded terrain · drainage & gradingOpen in demo

What you get

  • Aerial map and photoreal 3D model of the whole course, accurate to about a centimeter
  • Elevation and drainage surface for irrigation and grading planning
  • Measured acreage of fairways, greens, roughs, and out-of-play areas
  • Contours and cut/fill for bunker, green, and cart-path projects
  • Ground-level 360° walkthroughs of signature holes and the clubhouse, pinned to the map
  • Shareable browser viewer for the super, the board, and contractors — a link, nothing to install
See the full Golf Courses page
10 / 11

Landfills & Waste Sites

Airspace and compaction, measured every flight

Landfill operators and engineers use our maps to track remaining airspace, verify compaction, and document the site on a cadence — the volumetric picture a walk-and-measure can't keep current. One flight turns the site into an elevation surface and 3D scan, so airspace-remaining, cell volumes, and month-over-month change come back as numbers you can put in a report. A recurring scan replaces a once-a-year manual measurement with a running record, at a fraction of the cost.

Challenges we solve

  • Remaining airspace and cell capacity estimated, not measured
  • Compaction and fill rate you can't verify between annual measurements
  • Regulatory documentation that's slow and costly to produce
  • No dated record of how the site changes month to month
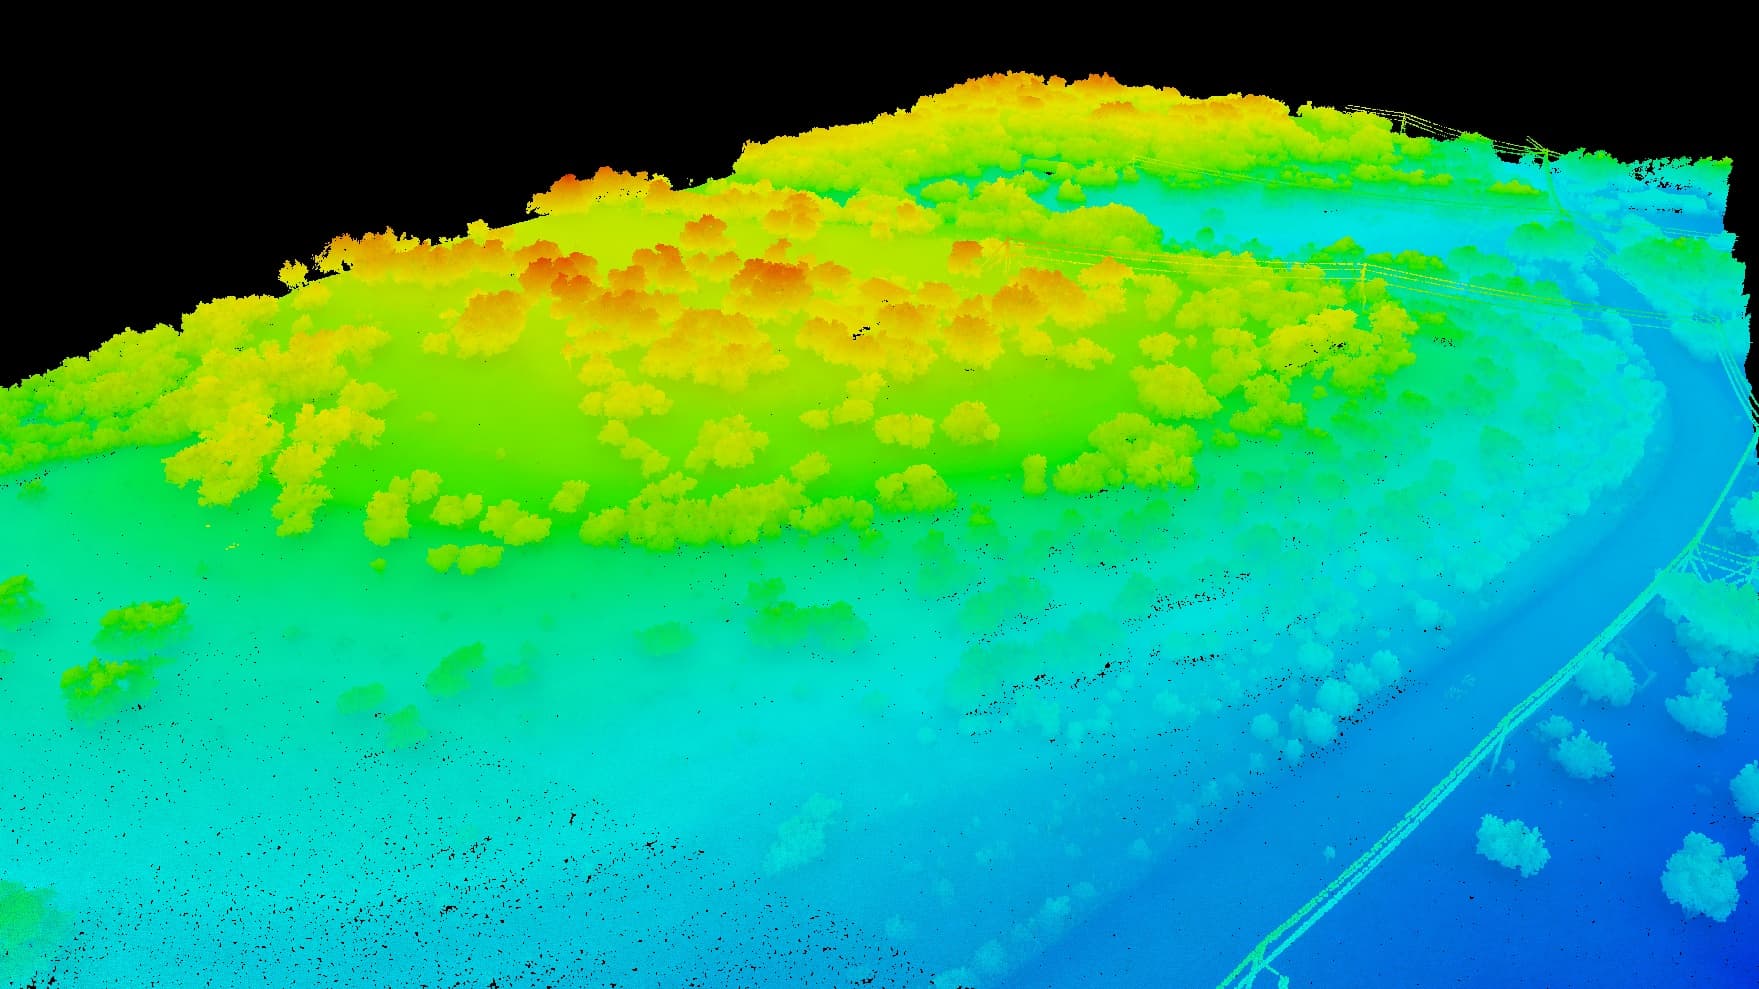
Color-by-elevation 3D scan of a site used for volume and airspace measurement
3D scan · elevation & volumesOpen in demo

What you get

  • Elevation surface and 3D scan of the whole site, accurate to about a centimeter
  • Airspace-remaining and cell volumes in cubic yards, against a prior surface
  • Compaction and fill-rate tracking between flights
  • Month-over-month change and documentation you can hand to regulators
  • Measurable browser viewer for operations, engineering, and compliance — a link, nothing to install
  • A recurring cadence that replaces the annual walk-and-measure with a running record
See the full Landfills & Waste Sites page
11 / 11

Government & Public Works

Current, shareable data for public projects — on a public budget

Municipalities and public-works teams use our mapping for road and drainage corridors, floodplain planning, and parks — current documentation the whole team and the public can open in a browser, without sending a crew out for every site. One flight covers a corridor faster than boots on the ground, and everyone works from the same record.

Challenges we solve

  • Floodplain and drainage decisions made on years-old data
  • Road and infrastructure corridors that need current documentation
  • Public projects that need transparent, shareable records
  • Tight budgets that can't cover a ground crew for every site
Color digital elevation model of a site used for floodplain and drainage planning
Digital elevation modelOpen in demo

What you get

  • Corridor and site aerial maps at centimeter-level accuracy
  • Bare-earth terrain and contours for drainage and grading
  • Elevation models for floodplain and stormwater planning
  • Ground-level 360° corridor and site documentation, navigable on the map
  • Measurable browser viewer for staff, council, and the public
See the full Government & Public Works page
Don't see your work?

If it has land, we can map it

These are the industries we fly for most, not a limit. Vineyards, quarries, golf courses, film sets, insurance, environmental work — if there's ground to document, tell us about it and we'll scope the right flight.

Get started

Ready to map your property?

Tell us about your site and goals, and we'll put together a custom proposal with exactly what you need.

Start Your Project