
Know where the water goes
Before you grade a pad, drop a culvert, or lay out a lot, it pays to know how water moves across the land. We fly your property at 1–3 cm per pixel and turn that elevation data into modeled drainage, flow, terrain, and wetness layers — the same maps engineers and ranchers use to plan with the water instead of fighting it.
From bare earth to a decision you can act on
Every layer builds on the one before it. Start with the shape of the ground, condition it so water moves honestly, follow where it concentrates, then read the result as drainage, wetness, and a plan. It is analysis derived from your elevation data — a planning tool, not a certified survey.
The starting point
Bare-earth terrain
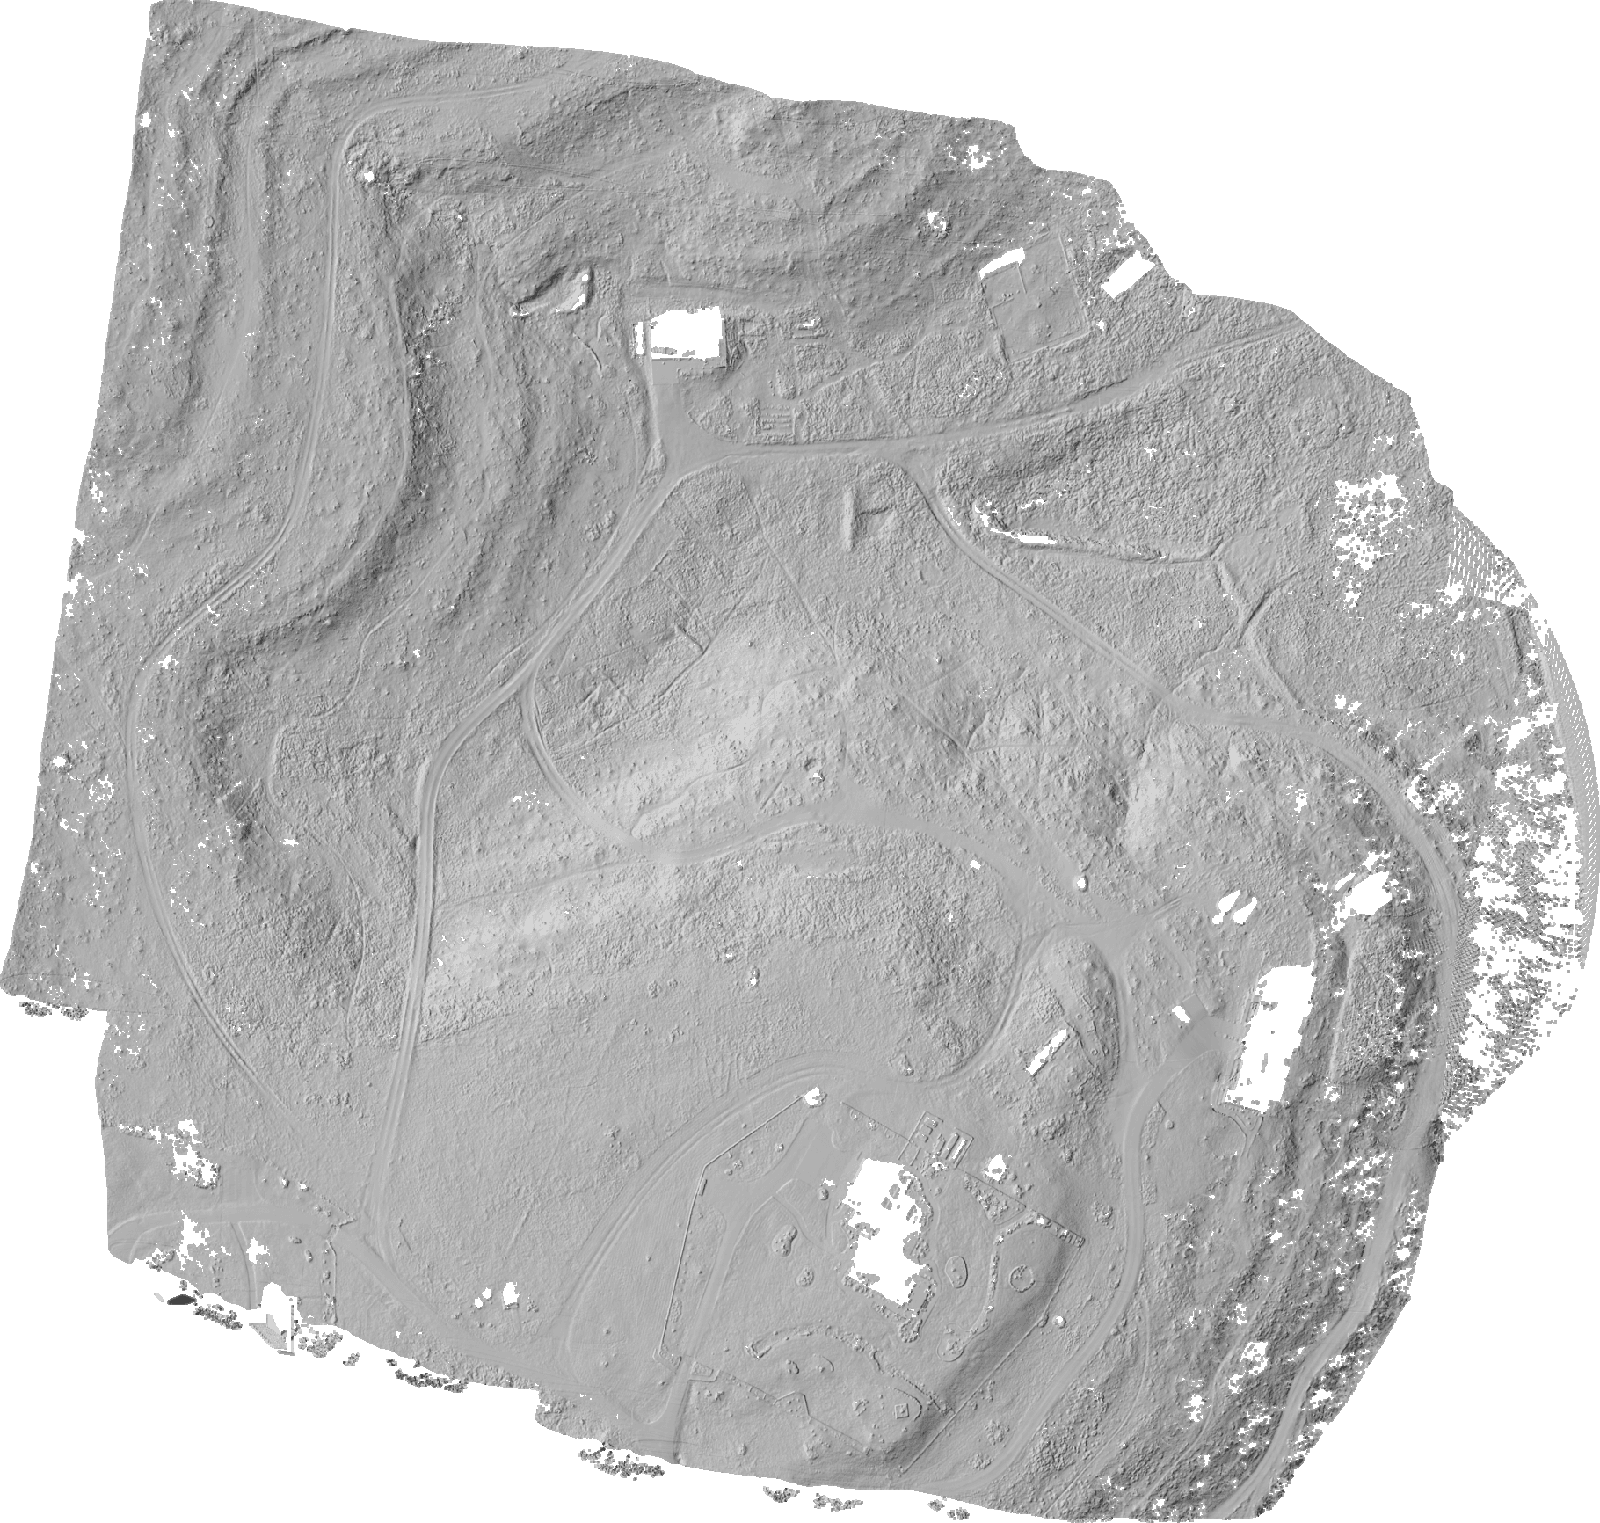
Everything starts with the ground itself. Laser scanning strips away brush and tree cover to leave a bare-earth elevation model, and a hillshade renders it so every swale, bench, and ridgeline reads at a glance — the shape of your land with nothing in the way.
- Bare-earth elevation model with vegetation removed
- Hillshade that makes subtle grade changes visible
- Centimeter-grade vertical detail across the whole site
Prepare the surface
Fill and condition the surface
Raw elevation models have tiny pits and gaps that would trap water in places it never actually pools. We hydrologically condition the surface — filling those artifacts and enforcing continuity — so the modeled water can move the way it does in the field.
What this step gives you
- Sinks and pits filled so flow paths stay continuous
- Flow direction resolved for every cell of the grid
- A clean foundation for the drainage layers that follow
Where water concentrates
Flow accumulation
With flow direction resolved, we accumulate how much upslope area drains through every point on the surface. The result is a map of where water concentrates — the faint threads that become swales, and the swales that become the channels carrying real volume after a storm.
What this step gives you
- Upslope contributing area for every point on the site
- Concentration corridors that reveal draws and channels
- The backbone for sizing culverts and drainage structures
The channels themselves
Strahler drainage network
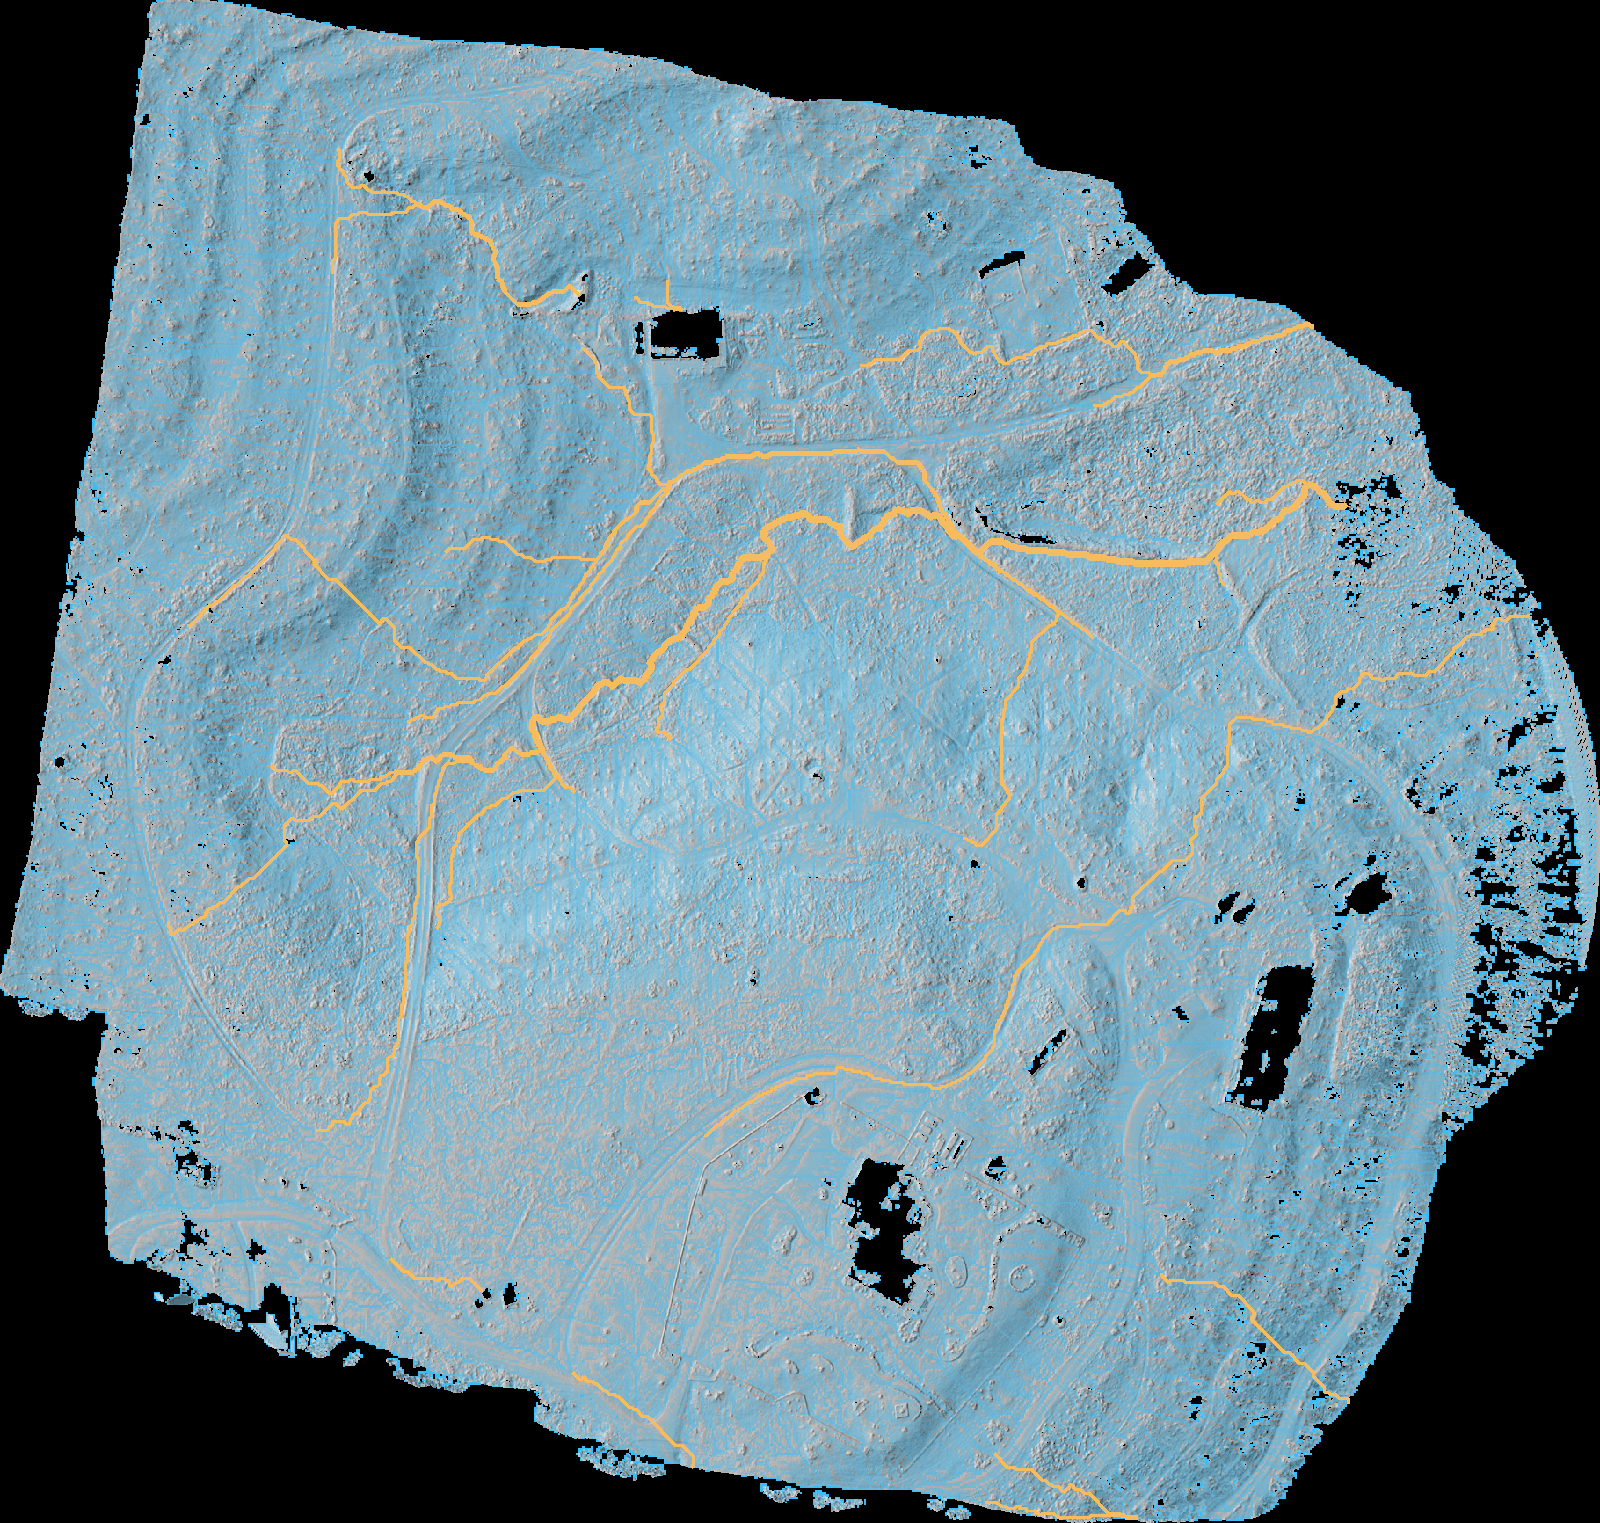
We extract the concentration corridors into a connected drainage network and rank each reach by Strahler order, so the trunk channels stand apart from the fingertip tributaries. It is the clearest single picture of how water moves across your property — and it lies on the ground in your 3D viewer, draped over the terrain.
- Connected channel network ordered by Strahler stream rank
- Trunk drainages separated from minor tributaries
- Delivered as GeoJSON for your GIS and KMZ for your phone
Where it pools
Terrain wetness (TWI)
A Topographic Wetness Index combines slope and upslope area to flag the low, flat places where water lingers and soils stay damp. It is how you spot the boggy corners, the natural pond sites, and the ground you want to keep buildings and drainfields away from.
What this step gives you
- Wetness index highlighting low, flat, water-gathering ground
- Natural pond and detention candidates surfaced early
- Soggy zones flagged before they surprise a foundation
What you do with it
Grading, culverts, ponds, and planning
Put together, these layers turn guesswork into decisions. Grade with the water instead of against it, size and place culverts where the flow actually concentrates, site a pond where the terrain already wants to hold water, and plan around the drainage before a shovel moves — all from data you can hand straight to your engineer or contractor.
What this step gives you
- Grading and earthwork that works with the natural drainage
- Culvert and detention placement backed by flow data
- Pond and stock-tank siting on the ground that holds water
- Floodplain-aware layout for lots, pads, and structures
The layers, one tap each
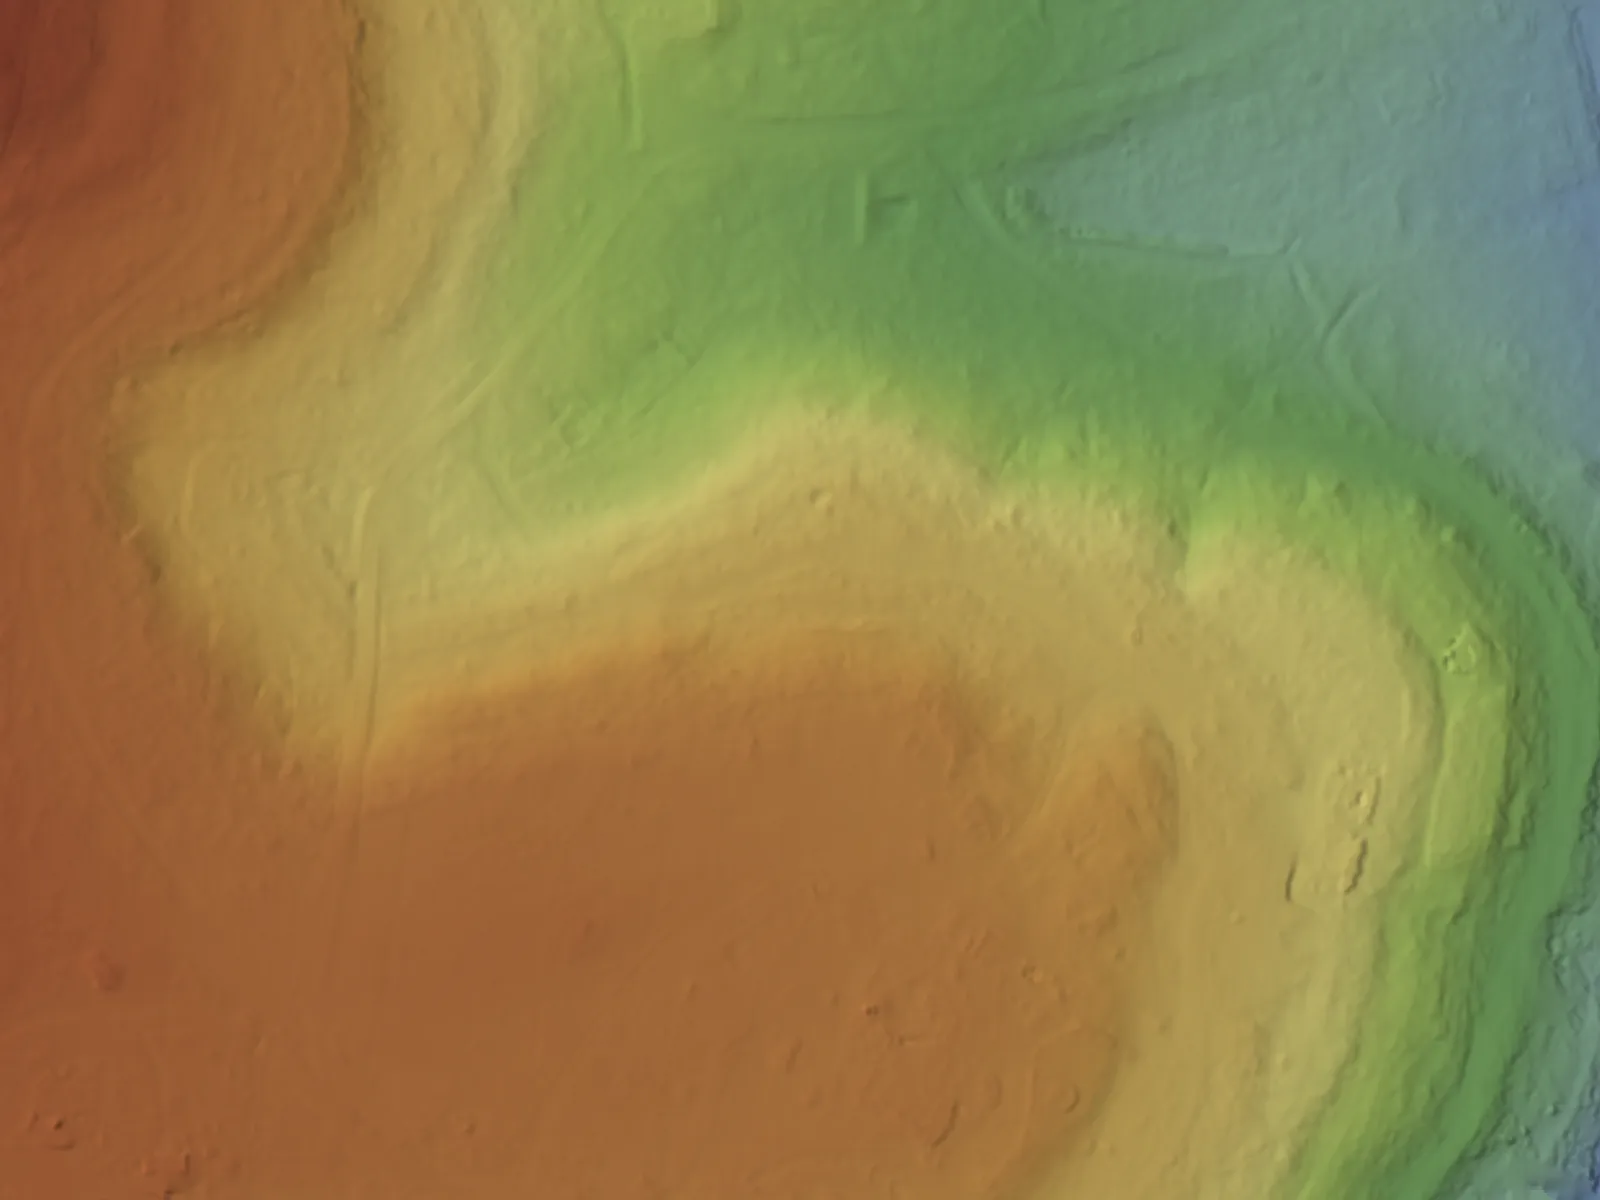
Our own ranch's LiDAR ground, coloured and shaded the way your viewer draws it — the same window in every frame, so the same draw and the same ridge are there under each layer.
 Bare earth
LiDAR strips the canopy: the ground itself, under the cedar, coloured by height — blue low, red high — and shaded so the shape reads. Every terrain and water layer is built on this.
LiDAR scan · Jul 2026 · 0.5 m · 299–324 m
Open it yourself
See a real drainage network
Here is a real drainage network from our own 40-acre Hill Country ranch — the exact kind of layer we derive for your property. Download it and drop it into any GIS or map app to see how the water threads across the terrain.
WGS 84 / UTM Zone 14N · Central Texas · contours open in AutoCAD · drainage in any GIS or map app
Map your land, then know where the water goes
Tell us about your site and we'll put together a scope with the drainage, flow, and terrain layers that fit your project — or open the live demo and explore the layers on a real property first.
What these layers are — and aren't
Drainage, flow, terrain, and floodplain layers are derived analysis computed from our elevation data to support planning and design. They are not a certified survey, a stamped engineering study, or a FEMA flood-zone determination.
This data is not a legal survey. Embry Solutions LLC does not perform land surveys. For boundary, subdivision, or title surveys, please consult a licensed Texas surveyor.