
Golf Courses
Every fairway and green, mapped — water, turf, and drainage on one link
Based in Dripping Springs · serving Central Texas
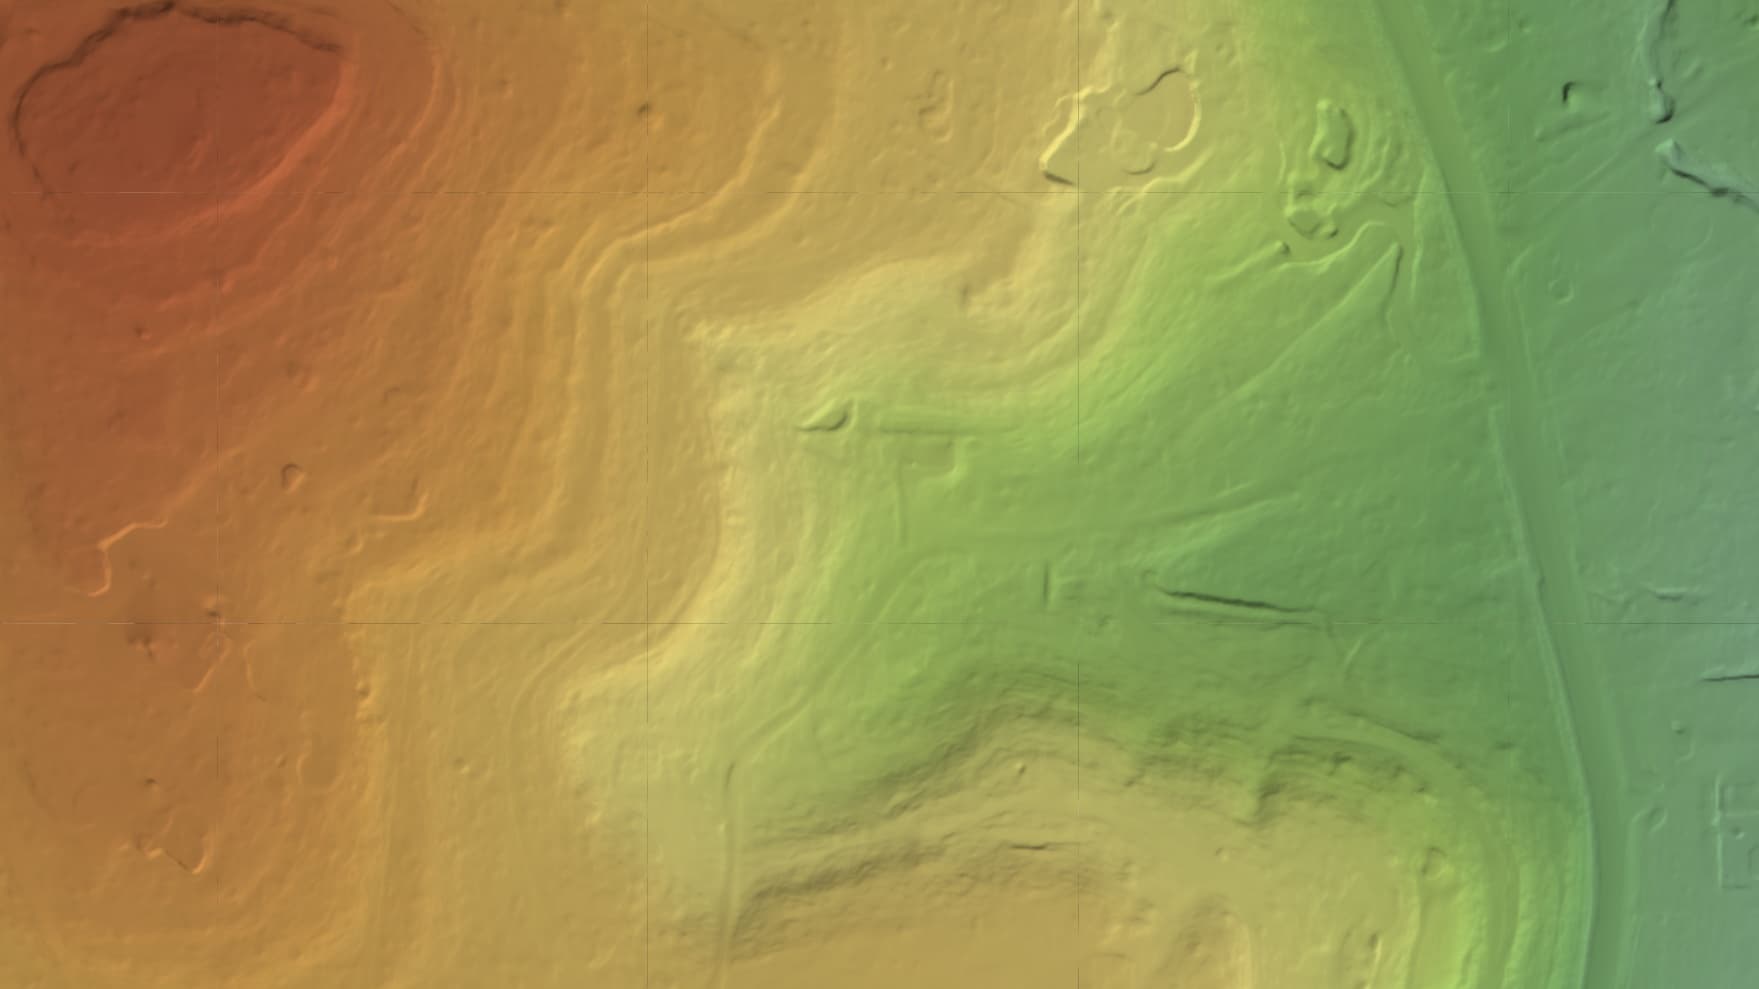
What we map for Golf Courses
Course superintendents and club managers use our maps to plan irrigation and drainage, document the whole property, and settle turf and grading questions with real elevation data — across a property that takes a cart and a morning to walk. One flight turns the course into a measurable 3D model and elevation surface, so drainage, cut/fill, and acreage come back as numbers, and a dated record tracks the course through renovations and seasons. On a course where water is one of the biggest line items, the map pays for itself the first time it catches a drainage or coverage problem.
What golf courses teams are up against
Deliverables built for the job
One flight, the full set — measurable to about a centimeter, all in a browser link, nothing to install.
- Aerial map and photoreal 3D model of the whole course, accurate to 2–5 cm horizontally — about a centimeter with the ground-control accuracy option
- Elevation and drainage surface for irrigation and grading planning
- Measured acreage of fairways, greens, roughs, and out-of-play areas
- Contours and cut/fill for bunker, green, and cart-path projects
- Ground-level 360° walkthroughs of signature holes and the clubhouse, pinned to the map
- Shareable browser viewer for the super, the board, and contractors — a link, nothing to install
Terrain & analysis layers
Extra layers we compute per-flight from your elevation data — no second trip to the site. Tell us which ones your project needs and we build them from your flight; golf courses teams use these to plan drainage, grading, and the ground under the cover.
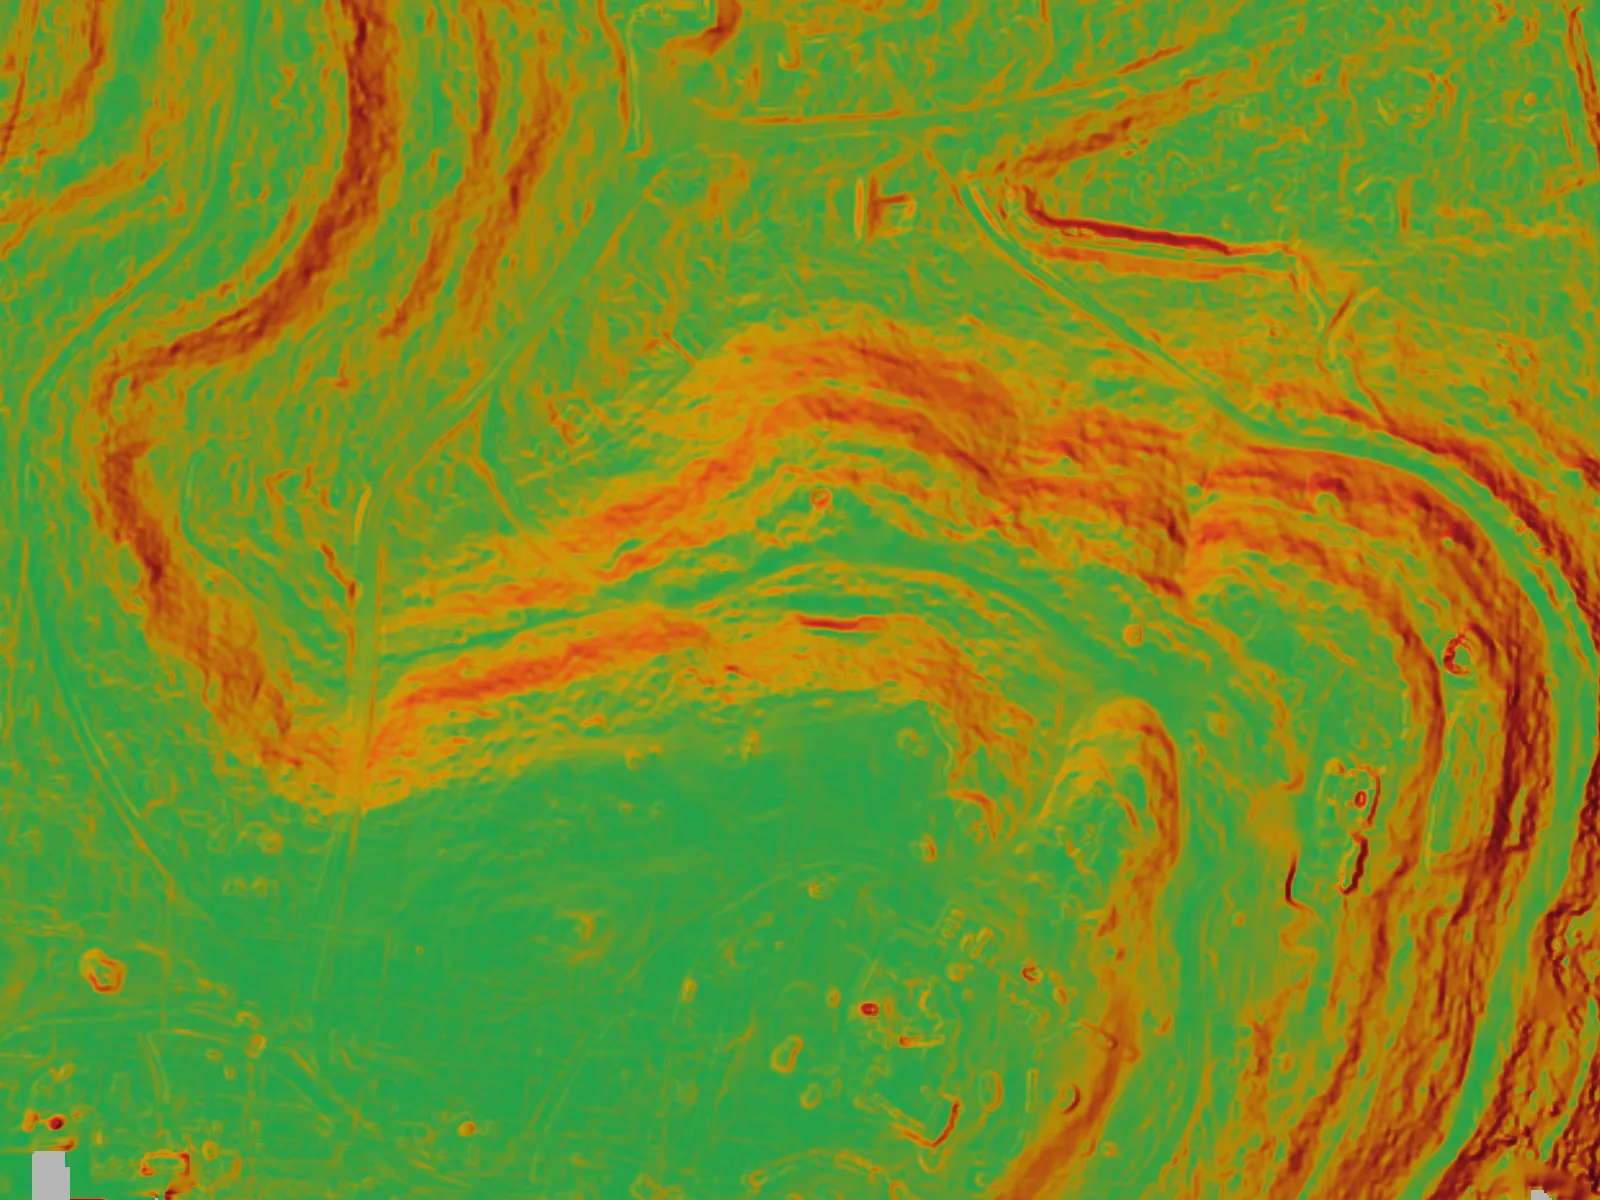 Slope
SlopeHow steep each spot is — green is gentle, red is not. Where a road, a pad or a trail can go without a fight.
LiDAR scan · Jul 2026 · 0–45°
Wetness index (TWI)
A topographic wetness map computed per-flight from your elevation data — it flags where water tends to collect and turf stays soggy, so you can target drainage and irrigation before a wet spot turns into a bare spot.
Flow & drainage lines
Modeled flow-accumulation lines computed per-flight from the bare-earth terrain — where water runs across the course after a storm, so you can plan swales, catch basins, and cart-path grading.
Drainage, flow, terrain, and floodplain layers are derived analysis computed from our elevation data to support planning and design. They are not a certified survey, a stamped engineering study, or a FEMA flood-zone determination.
The service lines behind it
Ready to map your property?
Tell us about your site and goals and we'll put together a custom proposal with exactly what you need — no cookie-cutter packages.
Based in Dripping Springs · serving Central Texas