
Where the Water Goes: Drainage, Flow & Wetness
Water moves downhill, and the shape of your land decides exactly where it goes. From your bare-earth elevation model we can model that behavior — tracing where runoff concentrates, mapping the drainage channels, and flagging the low, wet ground that tends to stay soggy. Here are the three drainage layers in plain English. For the full story on the Land & Hydrology Analysis service, see that page.
First, we fill the sinks
Real elevation data has tiny dips and pits — some real, some just noise. Before modeling flow, we "fill" those pits so water can route continuously downhill the way it actually does, instead of getting trapped in a one-cell hole. That filled surface is the foundation for everything below.
Flow accumulation (where runoff concentrates)
What it is: for every spot on the property, flow accumulation counts how much upslope land drains through it. High up on a ridge, almost nothing drains through — the number is tiny. Down in a draw where many slopes funnel together, the number is huge. Rendered as a glowing overlay, it lights up the paths water takes across your land.
When to use it: finding the problem spots before a storm. Flow accumulation shows where sheet flow gathers into a channel, where a culvert or crossing is actually needed, and where concentrated runoff will scour a road or a pad. It's the difference between guessing and seeing.
The Strahler drainage network (the channels, ordered)
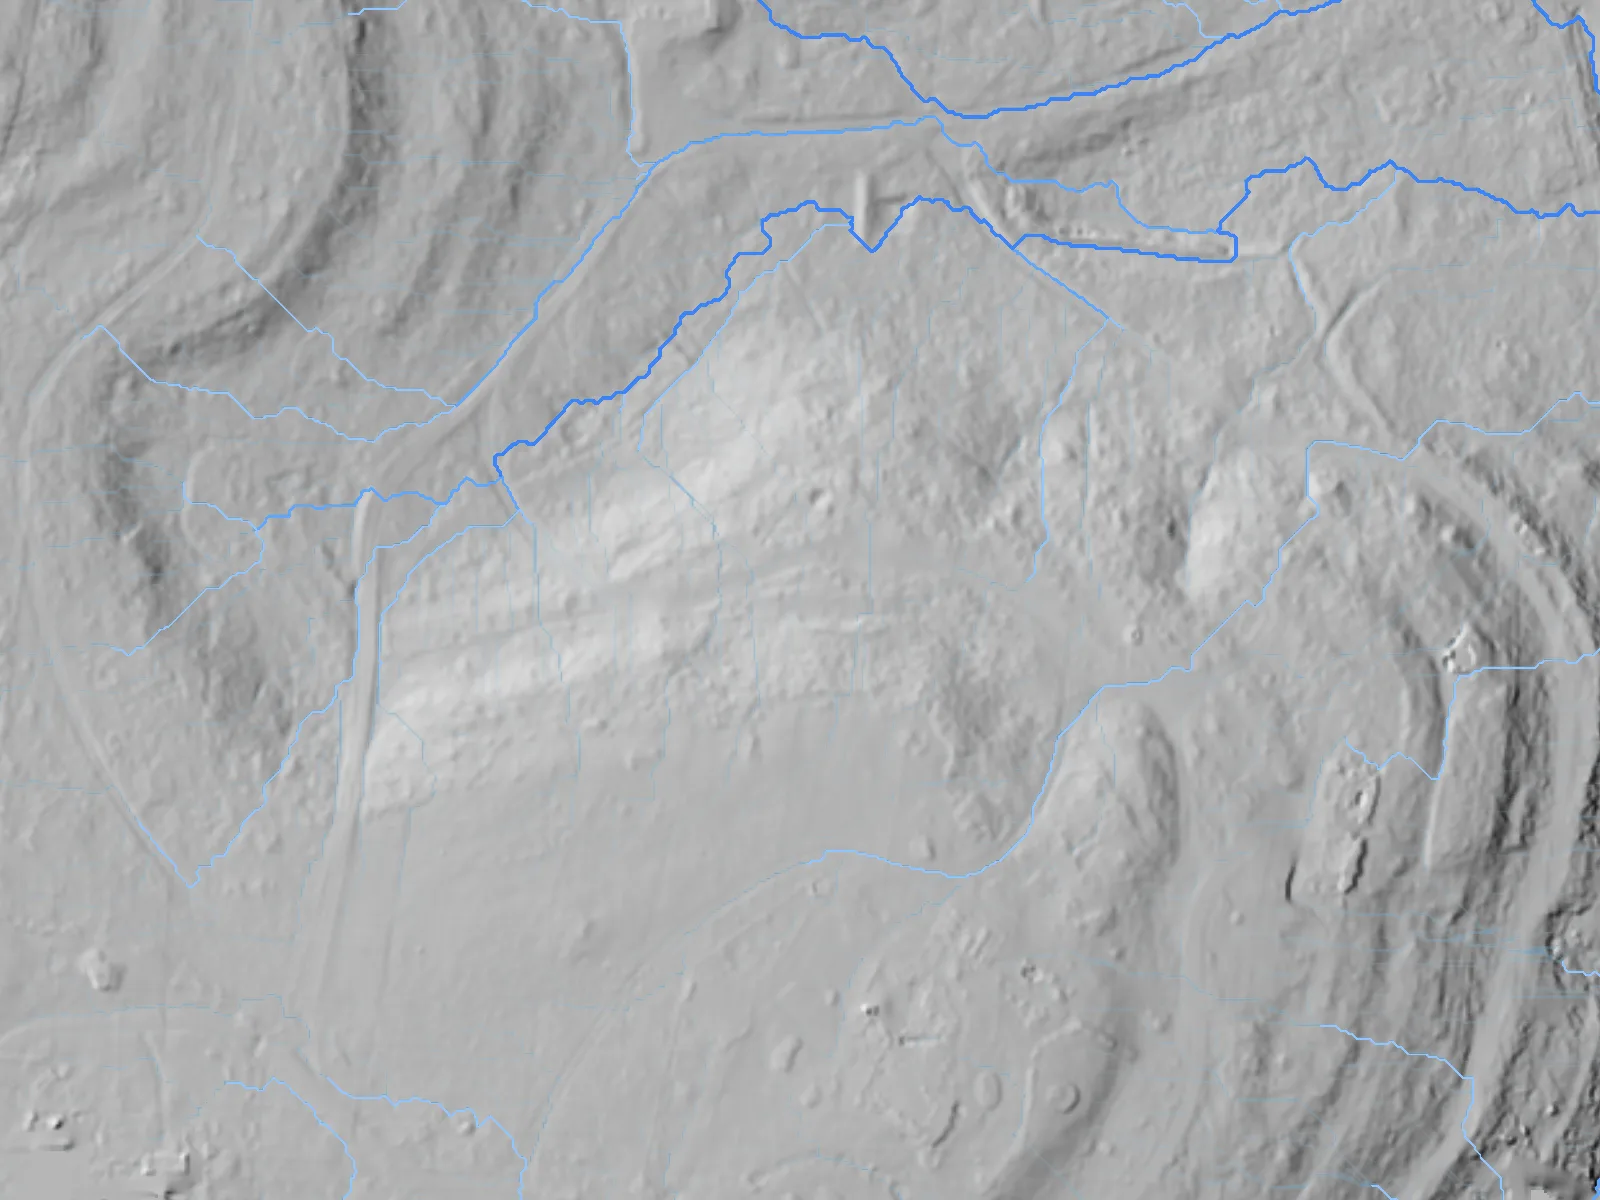
What it is: where flow accumulates past a threshold, it becomes a channel — and we extract those channels as a connected drainage network. The Strahler order ranks each branch: the smallest headwater trickles are order 1, and when two same-order channels meet, the combined channel steps up an order. So the network shows not just where the drainages are but which are the minor fingers and which are the main arteries carrying the most water.
When to use it: siting, permitting conversations, and land planning. The drainage network tells you where the natural watercourses run so you can plan crossings, keep structures clear of the main flow paths, and understand how your property drains as a system. You can open the modeled network right in Google Earth — it's one of the layers in your downloadable sample set (embry-sample-drainage.kmz).
The Topographic Wetness Index — TWI (where it stays wet)
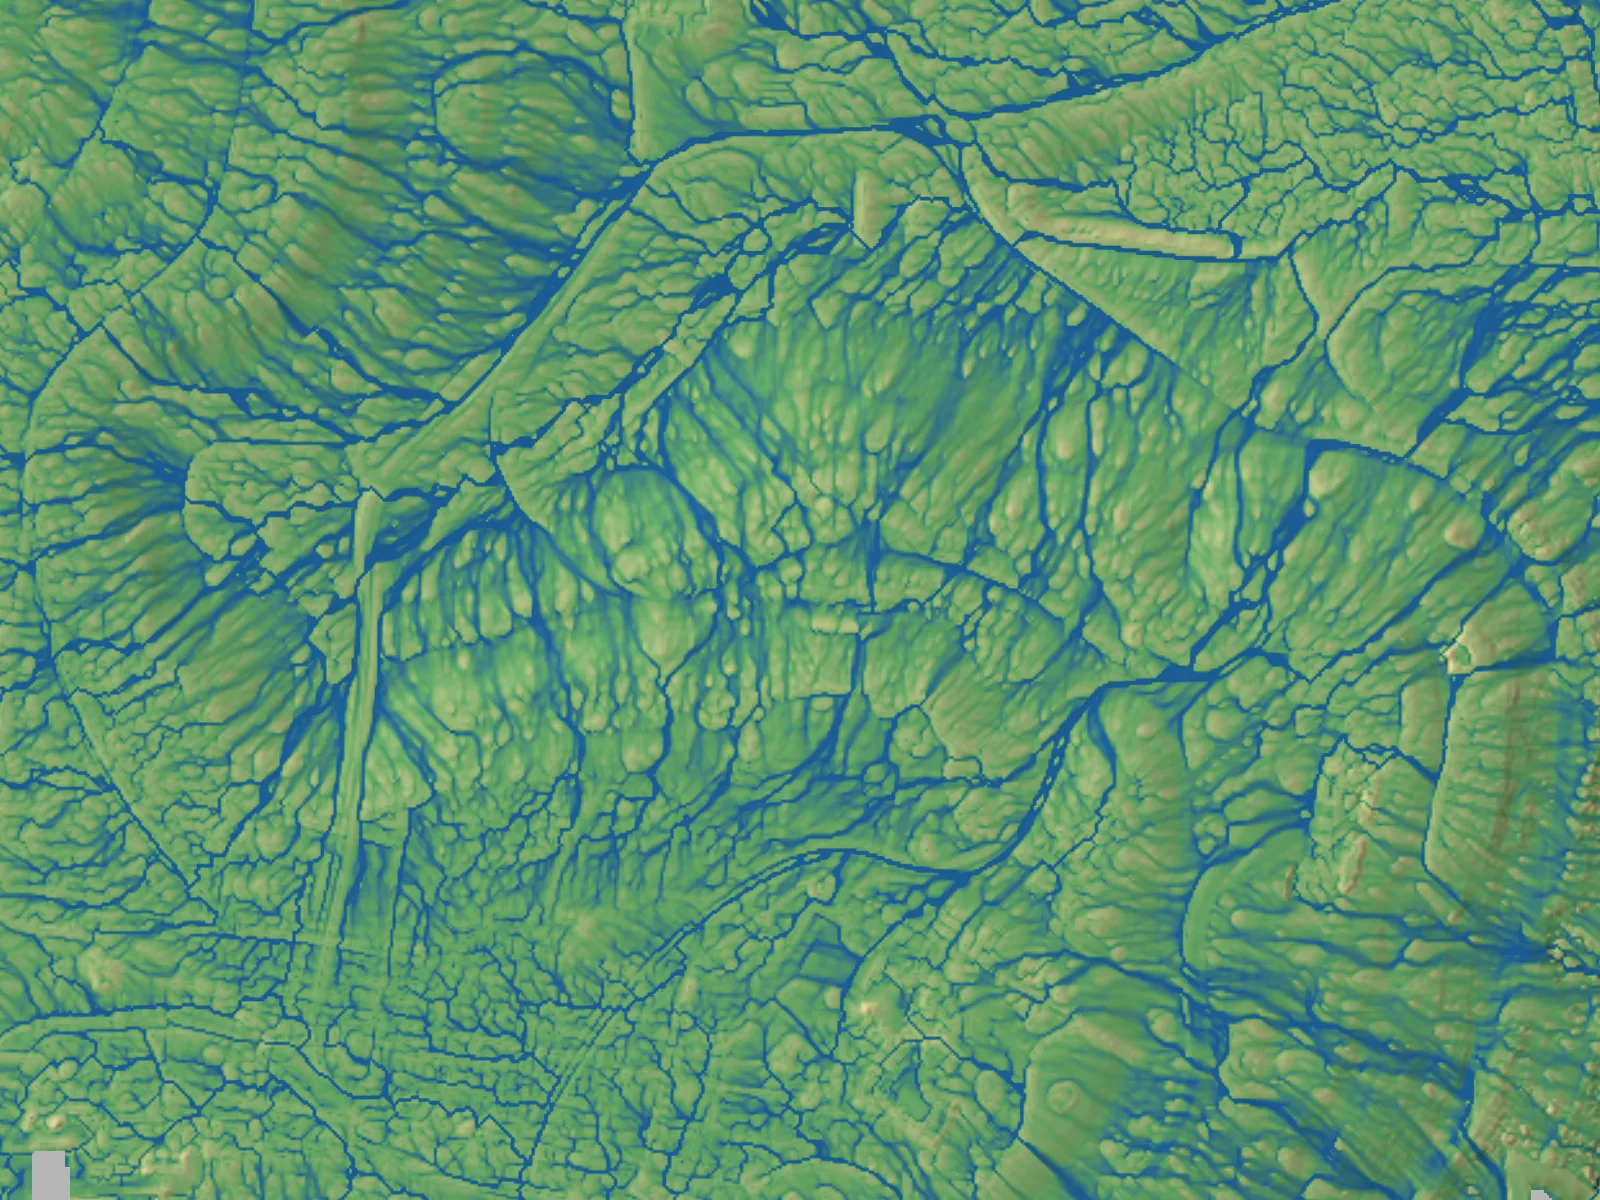
What it is: TWI combines two things at every point — how much land drains into it and how flat it is — into a single "wetness" score. A lot of upslope water arriving on flat ground scores high (water pools and lingers); a little water on a steep face scores low (it runs right off). The result is a map of where soil tends to stay saturated.
When to use it: anywhere moisture matters. High-TWI zones are your likely wet spots, seeps, and ponding areas — the ground that's soft for equipment, slow to dry, and prone to holding water. For ranch and land planning it flags where a pond might hold, where to keep a road out of the mud, and where vegetation will stay green longest in a dry spell.
Reading them together
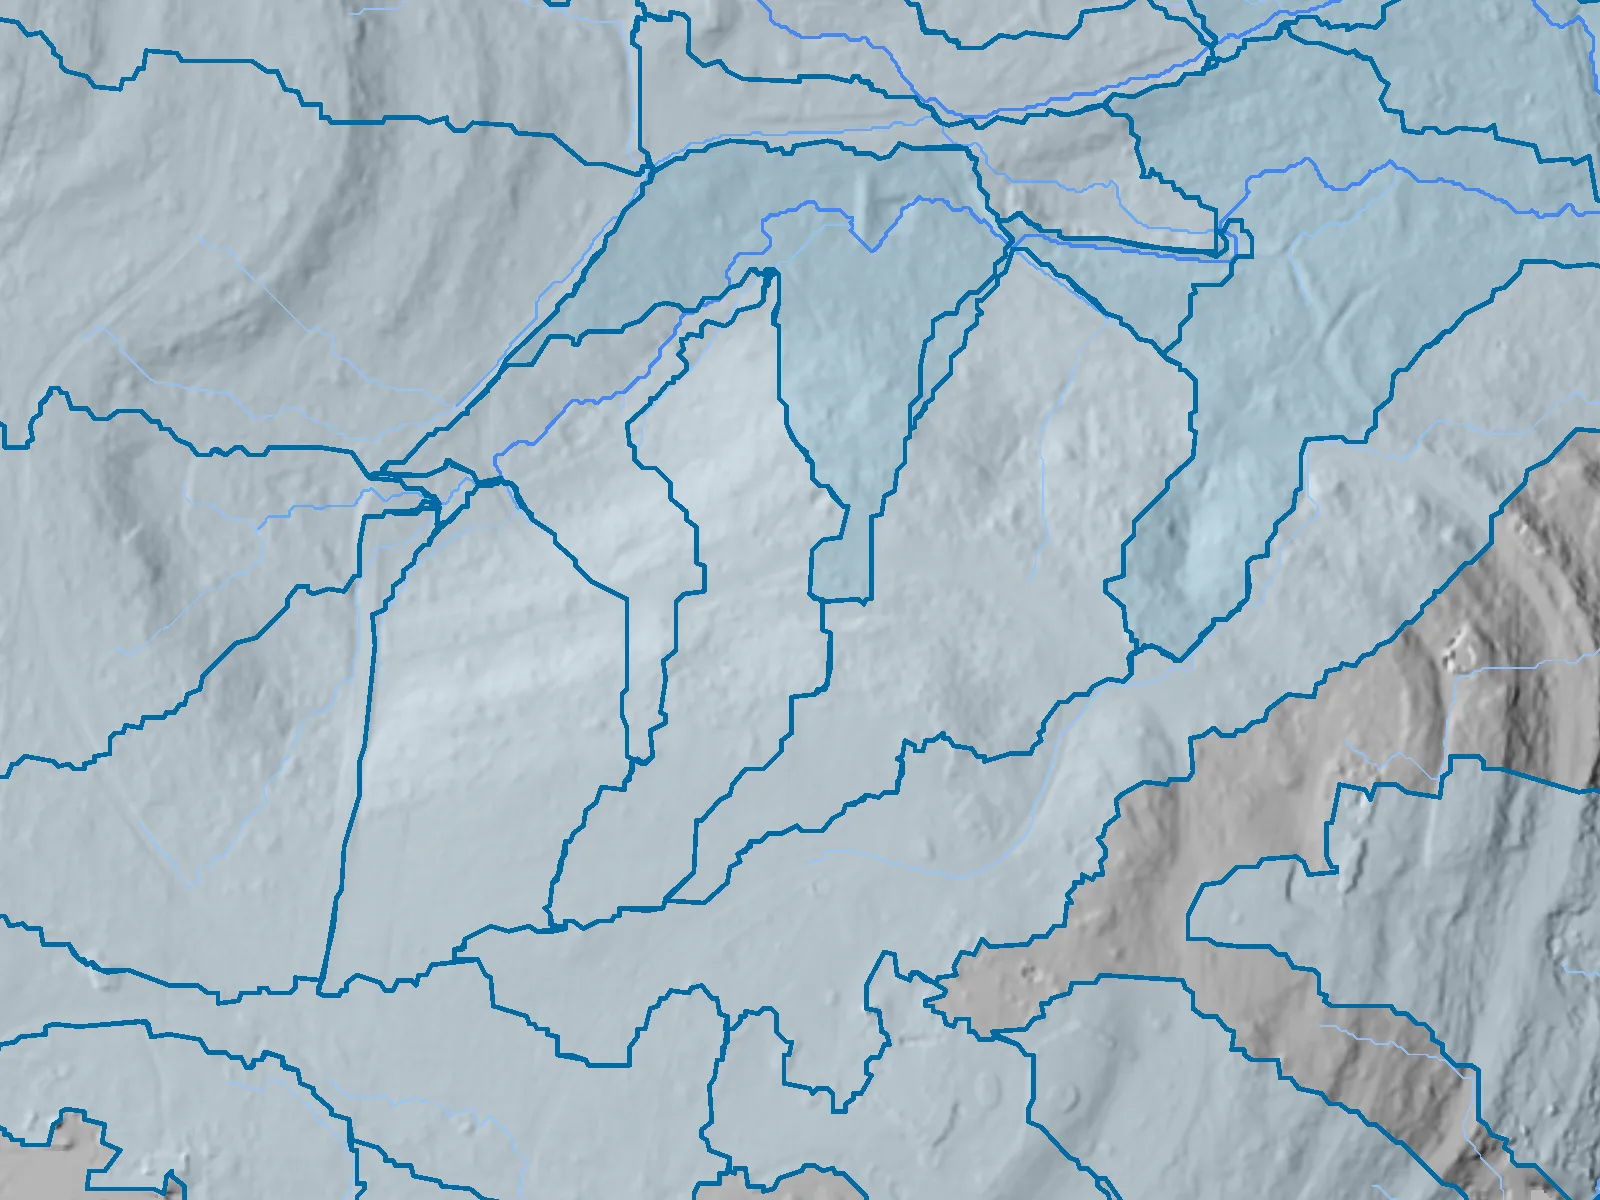
Flow accumulation shows the paths, the Strahler network shows the channels, and TWI shows the wet ground. Overlaid on the hillshade terrain layer, they turn a static map into a working model of your property's water — where it runs, collects, and lingers.
The honest limit — read this part
Drainage, flow, terrain, and floodplain layers are derived analysis computed from our elevation data to support planning and design. They are not a certified survey, a stamped engineering study, or a FEMA flood-zone determination. This is a model of how water behaves based on the shape of the ground — powerful for planning, early design, and understanding your land — but it does not replace a hydrology and hydraulics study from a licensed engineer, and it is not an official floodplain or flood-insurance determination. For regulatory floodplain questions, work from FEMA's mapping and a licensed professional. Embry Solutions does not perform land surveys; for boundary or title work, consult a licensed Texas surveyor.
Related guides
Reading Your Terrain Layers (Hillshade, Slope, Aspect, Contours)
The four terrain layers we derive from your elevation model — hillshade, slope, aspect, and contours — what each one shows, and when to reach for it for grading, drainage, siting, and access planning.
Seeing Under the Cedar: Canopy Height (CHM) & Bare Earth
How a LiDAR scan sees the real ground beneath brush and cedar — the difference between the top surface (DSM) and bare earth (DTM), and the Canopy Height Model (CHM) that measures the vegetation in between.
Measurements, Elevation & Volumes — turning the map into numbers
How to pull real numbers out of your data: distances and areas, terrain elevation profiles and contour lines, and cut/fill volume calculations for stockpiles and earthwork.
How Accurate Are Your Maps? (Accuracy Expectations)
What 'accurate to about a centimeter' really means, how ground control and check points prove it, what changes the number in practice, and the honest line on legal surveys.
Didn't find your answer? Contact us and we'll help you out.